


Calculating GDP Growth Rate: A Quick Guide
GDP growth shows if an economy is expanding or contracting, helping investors spot key trends.
• Simple math reveals the GDP percentage change between periods.
• Data gathering and careful calculations are essential.
• Distinctions between nominal (face value) and real (inflation-adjusted) figures matter to investors.
We break the process down into clear steps. First, collect accurate economic data. Next, calculate the period-to-period percentage change. Finally, compare nominal numbers with real figures to uncover true economic movement.
Understanding GDP fundamentals is vital for investors and market watchers. This simple approach turns complex economic data into actionable insights.
Key Steps to Calculating GDP Growth Rate
GDP (Gross Domestic Product) measures a country's total output. A positive GDP indicates growth, while a negative value signals contraction. Investors and traders rely on this metric to gauge economic health. The formula is ((GDP_current – GDP_previous) ÷ GDP_previous) × 100, which calculates the percentage change.
• Accurate data is essential.
• The year-over-year change gives the annual growth rate.
• This percentage helps compare economic performance across time frames.
Step-by-step process:
- Collect GDP figures for the current and previous periods.
- Subtract the previous period's GDP from the current period's GDP, and then divide by the previous period's GDP.
- Multiply the result by 100 to determine the GDP growth rate as a percentage.
This method provides a clear measure of economic performance, making it easier for market professionals to see if an economy is expanding or contracting.
Distinguishing Nominal and Real GDP Growth Rates

Nominal GDP shows how much the economy has grown in current dollars without removing the impact of inflation. Rising prices can make the economy look bigger than it really is.
- Investors often check nominal figures first.
- Nominal growth may overstate true production if inflation is high.
- For instance, during heavy inflation, nominal GDP could exceed 10% while real growth stays flat.
Real GDP adjusts for inflation using a price index or GDP deflator, canceling out the impact of rising prices.
- This gives a more accurate view of true economic output.
- It makes it easier to compare performance across different time periods.
- Policymakers use real GDP data to fine-tune economic strategies.
By using a price index, the growth rate reflects changes in actual production, not just price hikes.
- This method helps analysts correctly track when the economy is expanding or contracting.
- It offers essential insight for reliable forecasts and strategic plans.
Selecting a Base Year and Price Index for Real Growth Calculations
Choosing the right base year sets a stable benchmark for comparing growth over time. A stable base year means steady prices and consistent economic activity, which leads to more precise growth rates. Methods like chain-weight volume measures help adjust for shifts in consumption and structural changes, ensuring the price index reflects real economic output.
Using the correct price index or GDP deflator cancels out inflation, giving a clearer picture of true economic performance.
- Stable base years produce more reliable growth comparisons.
- Chain-weight measures adjust for changes in consumption patterns.
- Accurate price indexes help assess real output trends that policymakers and analysts trust.
Practical Example of GDP Growth Rate Calculation
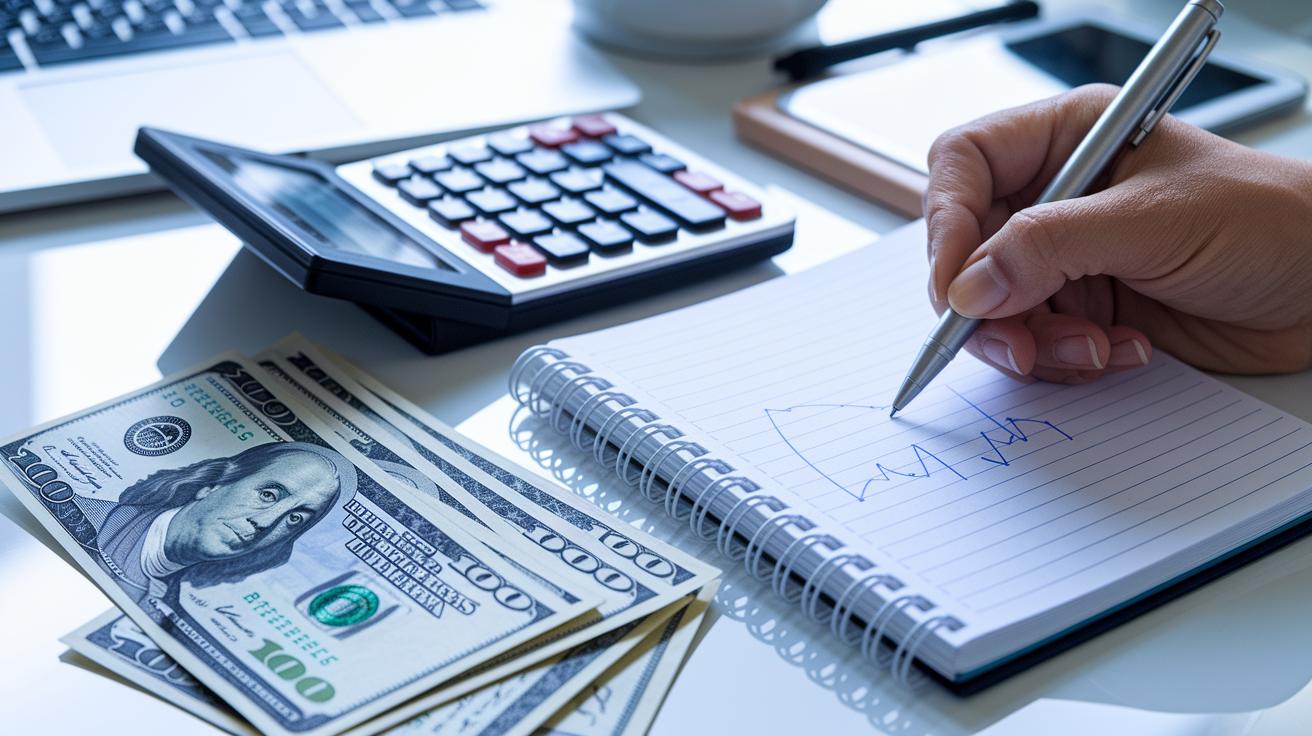
To calculate the GDP growth rate, subtract last year’s GDP from this year’s GDP, then divide the difference by last year’s GDP and multiply by 100. This simple math shows how much the economy grew or shrank.
• Method: ((Current GDP – Previous GDP) ÷ Previous GDP) × 100
• Example: Moving from $2,000bn in 2021 to $2,100bn in 2022 equals a 5% increase
• Use: Investors and policymakers track these numbers to forecast trends
Accurate data provides clear signals of economic performance and helps market professionals decide how to act.
| Year | GDP Value | Growth Rate |
|---|---|---|
| 2021 | $2,000bn | N/A |
| 2022 | $2,100bn | 5% |
This example shows how clear data and basic calculations offer a quick view of economic progress, helping shape strategic investment and policy decisions.
Implementing GDP Growth Rate Formulas in Excel
Open your Excel file where you have historical GDP data in consecutive cells. To calculate the nominal GDP growth, use a simple cell reference formula. For example, if last year’s GDP is in cell B1 and this year’s is in B2, type =((B2-B1)/B1)*100 to get the percentage change. You can drag this formula down to cover additional periods.
• Nominal Growth: =((B2-B1)/B1)*100
• Drag the formula for multiple cells
To work out real GDP growth, first adjust the nominal values with the GDP deflator. If the current period’s deflator is in cell C2 and the previous period’s is in C1, calculate real GDP as B2/C2 for the current period and B1/C1 for the prior. Then use =(((B2/C2)-(B1/C1))/(B1/C1))*100 to find the growth rate. This approach removes inflation effects, showing a truer picture of economic progress.
• Real GDP Current: B2/C2
• Real GDP Previous: B1/C1
• Real Growth: =(((B2/C2)-(B1/C1))/(B1/C1))*100
Once both growth rates are set up, use Excel’s charting tools to visualize trends over time. Create line charts comparing nominal versus real growth and link your charts with cell-reference formulas so they update automatically. This straightforward financial model lets you analyze data quickly and make informed decisions about economic forecasts.
Analyzing and Interpreting GDP Growth Trends
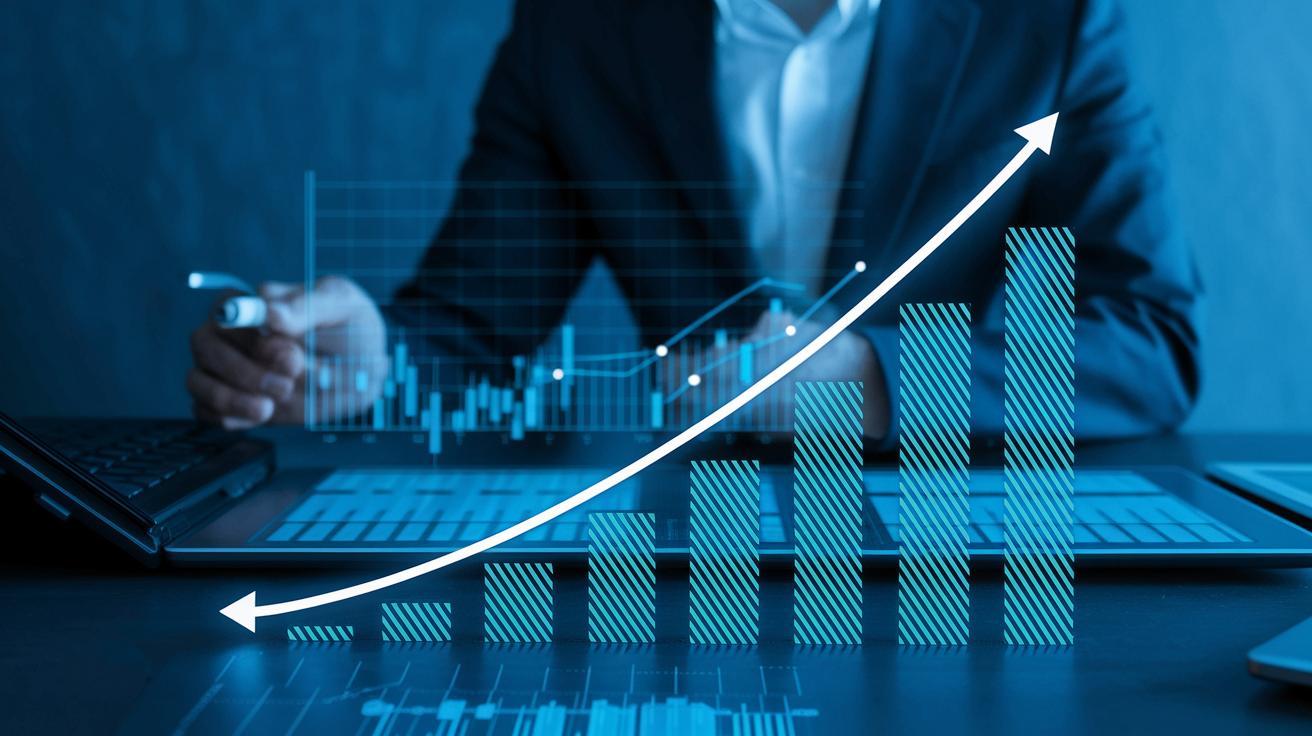
GDP growth rates show how well the economy is doing. Higher rates mean more production, while lower or negative rates signal an economic pullback.
• Rising numbers point to increased output.
• Falling figures warn of contraction.
• These trends guide investment and policy shifts.
• Analysts use current and past data to spot cycles.
Understanding these trends is key. With steady increases above past averages, there’s confidence in stability. In contrast, low or erratic figures suggest caution. Market experts and policymakers pay close attention to these signals as they adjust monetary policies and fiscal strategies.
Looking at GDP trends over time highlights economic cycles. Analysts mix trend data with industry models to forecast future changes. Regular patterns often indicate steady expansion, while volatile numbers urge a careful approach. This analysis helps investors, advisors, and policymakers shape strategies, manage resources, and plan for future risks.
Final Words
In the action, the article broke down key steps in understanding GDP growth and the standard formula while also comparing nominal and real trends. It explored selecting base years, employing price indices, and applying Excel functions for smoother calculations.
By mastering how to calculate gdp growth rate, you gain clearer insights into economic trends. This knowledge helps pinpoint market moves and fuels confident decisions. Stay alert and keep refining your approach to make the most of emerging opportunities.
FAQ
How to calculate real GDP growth rate?
Calculating real GDP growth rate involves adjusting nominal GDP by removing inflation. It uses the formula ((GDP_current – GDP_previous) ÷ GDP_previous) × 100 after deflating nominal GDP with a price index.
How to calculate GDP growth rate per capita?
Calculating GDP growth rate per capita involves dividing the total GDP growth by the population. This method shows how average personal output or income changes with overall economic growth.
How to calculate GDP growth rate in Excel?
Calculating GDP growth in Excel requires placing GDP values in cells and using a formula like =(Current GDP – Previous GDP) / Previous GDP * 100. This approach simplifies computation and trend analysis.
How to calculate economic growth rate?
Calculating the economic growth rate mirrors the GDP growth calculation. It determines the percentage change in total output from one period to the next, offering insights into overall economic performance.
How to calculate future GDP with growth rate?
Calculating future GDP involves applying an anticipated growth rate to the current GDP. Multiply current GDP by (1 + expected growth rate) to estimate economic size for a future period.
What is the formula for calculating GDP?
The GDP formula adds together consumption, investment, government spending, and net exports. It is represented as GDP = Consumption + Investment + Government Spending + (Exports – Imports).
What is the formula for growth rate?
The standard growth rate formula is ((Current value – Previous value) ÷ Previous value) × 100. This formula quantifies the percentage change between two time periods.
How to calculate GDP in 3 ways?
GDP can be calculated using three approaches: the production (output) method, the income method, and the expenditure method. Each approach provides a unique view of overall economic activity.