


Market Signal: Forward Yield Curve Guides Rate Outlook
Investors use the forward yield curve to read future interest rate moves and gauge market sentiment.
• It plots expected rates by aligning dates with percentages.
• It combines data from short-term futures and longer-duration swap rates.
• The curve offers real-time insights to help adjust loan terms, trading tactics, and portfolio allocations.
The forward yield curve is more than just a graph. It pulls together key data into a simple tool that market professionals can use to spot trends and plan ahead with confidence.
forward yield curve shines with clear insights
The forward yield curve is a graph that shows expected future interest rates by matching rates on the Y-axis with the dates on the X-axis when they become effective. It gives investors and analysts a quick view of market expectations for fixed versus floating rates over different time spans.
• The curve uses market inputs like cash-settled futures (for short-term up to 2 years) and swap rates (for longer maturities).
• It is built through methods such as quantitative yield evaluations and bootstrapping.
• Regular updates ensure the curve reflects the latest market actions and anticipated trends.
Short-term projections come from instruments like SOFR-based futures, while longer outlooks rely on swap rate data collected across a broad market. Investors use this information to adjust portfolios quickly, and financial institutions often shift to fixed-rate loans or deploy hedging strategies when the curve signals rising rates. Market professionals routinely tweak trading tactics after a glance at the curve, making it one of the fastest tools to capture future rate shifts.
Calculating Forward Rates on the Yield Curve

Precise implied rates drive clear, actionable market moves. They highlight trends and support accurate derivative pricing, allowing traders to adjust their strategies effectively. Using liquid instruments like SOFR futures and swap quotes, market participants convert raw data into measurable yield figures.
• Gather spot rates and futures quotes
• Convert futures prices to yields
• Build the zero-coupon curve
• Compute forward rates using interpolation formulas
• Adjust for factors like convexity and day-count
• Cross-check against market swap rates
| Instrument | Method |
|---|---|
| SOFR Futures | Convert prices to yields |
| Interest-Rate Swaps | Bootstrapping via par-swap rates |
| Bootstrapping Algorithm | Sequential stripping of zero rates |
Analysts validate these forward rates by comparing them with market swap quotes. When discrepancies appear, they fine-tune adjustments like convexity and day-count to close the gaps. They also stress-test models under different conditions to catch any pricing or interpolation errors early. Regular reviews and recalibrations ensure the computed forward rates continue to guide hedging, debt management, and derivative pricing decisions effectively.
Forward Versus Spot Yield Curve Comparison
The spot yield curve shows today's zero-coupon yields, giving a clear view of current market conditions. Meanwhile, the forward yield curve projects future interest rates using market expectations and pricing data from derivatives. In simple terms, the spot curve tells you what is known now, while the forward curve hints at where rates might go.
• Spot curve data comes from Treasury bond prices (on-the-run issues).
• Forward curve data relies on instruments like SOFR futures and swap rates.
• Investors use the spot curve to value portfolios based on today's sentiment.
• Traders and risk managers use the forward curve to price derivatives and forecast interest rate changes.
Policy moves, like Fed rate changes, can make the spot curve steeper yet flatten the forward curve if long-term outlooks weaken.
| Feature | Spot Yield Curve | Forward Yield Curve |
|---|---|---|
| Definition | Today’s zero-coupon yields | Expected future rates |
| Data Source | Treasury bonds | SOFR futures, swap rates |
| Primary Use | Portfolio valuation | Derivative pricing and forecasts |
| Market Implication | Reflects current sentiment | Indicates forward rate expectations |
Traders typically rely on the spot yield curve to gauge current market pricing for their portfolios. In contrast, the forward yield curve helps plan for future interest rate moves and manage related risks.
Constructing the Forward Yield Curve: Data and Smoothing

We begin by collecting today's market data, swap-rate quotes, SOFR futures, and cash instruments, to capture current interest rate trends. This data is the backbone for building a continuous zero‐coupon series that reflects expected future rates.
• The raw market data gives a clear snapshot of current rates.
• Interpolation and extrapolation methods fill gaps across different maturities.
• Smoothing techniques reduce noise to reveal clearer trends.
Data Collection
Data comes from active swap markets, treasury yields, and SOFR futures that mirror short-term expectations. Using these sources, the curve blends forward-looking figures with historical yields, creating a solid foundation for analysis.
Interpolation and Extrapolation Techniques
When some maturities lack data, we apply linear or cubic interpolation to fill the gaps. Bootstrapping strips rates from the combined instruments to form a zero‐coupon curve. Extrapolation goes beyond available figures to forecast rates further out.
Smoothing and Adjustment Methods
We use moving average filters and exponential smoothing to dial down short-term volatility. These adjustments also handle day-count issues and potential convexity impacts, ensuring the curve accurately mirrors market conditions. Analysts then run quality checks and stress tests against market swap rates and historical benchmarks to confirm its reliability for risk management, derivative pricing, and broader capital market analysis.
Using the Forward Yield Curve in Bond Pricing
The forward yield curve is essential for pricing bonds and derivatives because it provides estimates of future rates that feed directly into valuation models.
• Traders use these forward rates in swap, cap/floor, and bond models for precise pricing and budgeting.
• The curve helps set benchmarks for interest expense and allows for testing different debt scenarios.
• Analysts rely on these projections to assess refinancing costs and debt service changes under stress conditions.
Analysts adjust models by "shocking" the curve (changing rates to mimic stress scenarios) to see how sensitive debt portfolios are to future rate movements. This technique gives a clearer picture of the present value of future cash flows, which is crucial for long-term pricing and risk assessment.
Derivatives like swaps and interest rate caps also depend on accurate forward rate projections. Traders update their pricing models using these rates to reflect expected market shifts. This method ensures that derivative pricing stays aligned with current market forecasts, improving overall pricing accuracy.
Portfolio managers benefit from forward rate data by fine-tuning hedging strategies and asset allocations. Expected rate changes help manage interest rate risk across fixed-income portfolios, enabling a balanced trade-off between risk and return in dynamic market conditions.
Forecasting and Risk Management with Forward Yield Curves
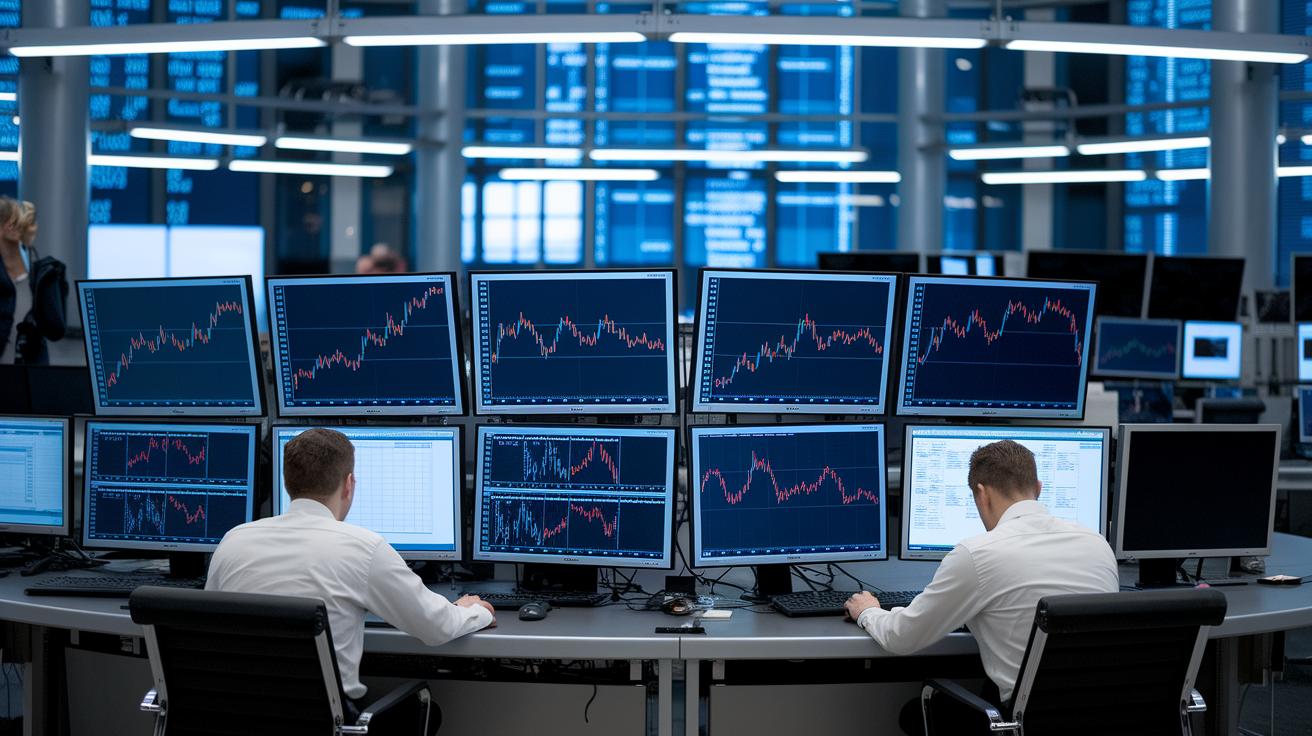
Market participants use forward yield curves to predict future interest rates and shape their strategies. They examine data like SOFR futures and swap rates to get a clear view of upcoming trends and adjust their lending and risk approaches.
• Institutions build models with interpolation and bootstrapping to create a zero-coupon curve that represents future conditions.
• Major banks recently used these curves to rebalance loan portfolios amid tightening credit and emerging risks.
• When the curve rises, firms often shift to fixed-rate loans and hedge with swaps or interest rate caps to manage potential rate hikes.
• Economic factors such as GDP, inflation, and Fed policy quickly change market expectations and impact the curve.
These insights help market players budget interest expenses and plan capital allocations. By watching macroeconomic signals and global trends, they keep forecasting models responsive and ready to act when conditions shift. This proactive use of the forward yield curve supports tighter risk management and agile financial planning in a volatile market.
Charting and Analytical Tools for Forward Curves
Python libraries like Pandas and Plotly pull forward rates and build charts, while Bloomberg terminals deliver strong rate projections and analytics for quick, clear insights. These tools simplify data extraction and visualization, making it easy to track shifts in the forward yield curve. Code-based backtesting paired with live feeds offers investors a dynamic setup for trend analysis. For example, Python libraries not only process complex datasets, they update charts instantly, bridging raw data with market-ready visuals.
• Python libraries provide fast, automated chart updates.
• Bloomberg terminals offer robust, real-time rate analytics.
• Live data feeds and backtesting create a dynamic market analysis environment.
Digital dashboards add another layer by offering interactive charts and real-time rate tracking. Custom alerts and drill-down options filter out noise to highlight key trends. The blend of simple visuals with powerful back-end calculations makes these platforms essential for managing interest rate trends. This real-time interactivity promotes swift decision-making and execution, ensuring traders and advisors stay on top of market shifts. Analysts use these tools to spot subtle changes, validate market models, and adjust their strategies quickly.
Limitations and Considerations for Forward Yield Curve Analysis

Forward yield curve projections may not always match actual future rates.
• Projections rely on current data, which can miss sudden market shifts.
• Volatility and unexpected news can twist the curve and affect derivative pricing.
• Even well-built models are prone to errors and carry inherent risks.
• Stress tests and scenario analysis help manage these risks.
The forward yield curve is useful, but its estimates can be off. Models based on today's data might not capture rapid changes, so the rate predictions can deviate from reality. This uncertainty can lead to pricing errors, especially when used for options like caps and floors.
Market events such as central bank moves, economic reports, or unexpected news can quickly change the curve’s shape. These dynamic forces often create a gap between forecasted and actual rates, making careful monitoring essential.
To counter these challenges, analysts use probabilistic scenario analysis and stress testing. By simulating different market conditions, they can spot potential deviations early. Combining risk premium models with volatility assessments builds a more resilient framework, helping professionals adjust their strategies when needed.
Final Words
In the action, we broke down key aspects of the forward yield curve from its core definition to its calculation methods.
We covered market-implied yield computations, compared spot versus forward measures, and examined bond pricing tools and forecasting techniques.
We also noted its role in risk management and potential limitations with real-world data.
This concise breakdown offers actionable insights for navigating market trends and spotting opportunities with clarity and confidence.
Keep these fundamentals in mind as you track market signals and refine your trading strategy.
FAQ
What is the forward yield curve?
The forward yield curve represents market expectations of future interest rates by plotting projected rates against settlement dates using data from instruments such as SOFR futures and swaps.
How do you interpret a forward yield curve?
Interpreting a forward yield curve means analyzing its shape to understand future rate expectations; a steep curve suggests anticipated increases in rates which can influence decisions on fixed-rate loans and hedging strategies.
What data is used for the SOFR and 10-year Treasury forward curves?
The SOFR forward curve relies on cash-settled SOFR futures and swap rates, while the 10-year Treasury forward curve utilizes on-the-run Treasury yields coupled with market derivatives to show expected future rates.
How does a forward yield curve chart work and what does it show?
A forward yield curve chart plots yields on the vertical axis and settlement dates on the horizontal axis, providing a visual representation of market-projected interest rates that assists in risk management and pricing strategies.
How are forward rates calculated with a forward yield curve calculator?
Calculating forward rates involves converting futures quotes to implied yields, applying bootstrap and interpolation methods, and adjusting for market factors, which helps derive forecast rates from existing market data.
Why is the forward curve not a forecast?
The forward curve reflects current market consensus on future interest rates rather than a guaranteed prediction; unexpected economic events or policy changes can cause actual future rates to differ from these projections.