


30-Year Treasury Yields Signal Shifts in Market Sentiment
The 30-year Treasury yield offers clues on how investors view growth, inflation, and upcoming policy moves.
• Today’s yield data paired with futures pricing reveals long-term trends.
• Dramatic highs and lows signal shifts in market stability.
• These trends may create opportunities in asset pricing and lending rates.
Investors track 30-year Treasuries for a clear picture of market sentiment. By combining current yields with futures pricing, experts can pinpoint changes in stability and unlock actionable insights for forward-looking strategies.
Defining the 30-Year Treasury Yield and Its Market Role
The 30-year Treasury yield is the annual return on U.S. government debt that matures in 30 years. It goes beyond short-term trends by reflecting long-term expectations for interest rates, inflation, and economic growth. Data from 1977 to 2026 show how investor sentiment has changed with economic cycles and policy shifts.
• Yields are set by combining current yield data with futures prices to capture median investor views.
• The 30-year yield mirrors long-term market expectations.
• Fixed-income investors use it to compare U.S. bonds with other investments, while it also influences asset pricing and lending rates.
Investors and advisers watch Treasury yields closely for clues about market stability and growth. The 30-year yield provides a key signal for making portfolio diversification and risk management decisions. When yields rise, bond prices tend to drop, often prompting a review of investment strategies.
Historical Trends and Chart Analysis of 30-Year Treasury Yields
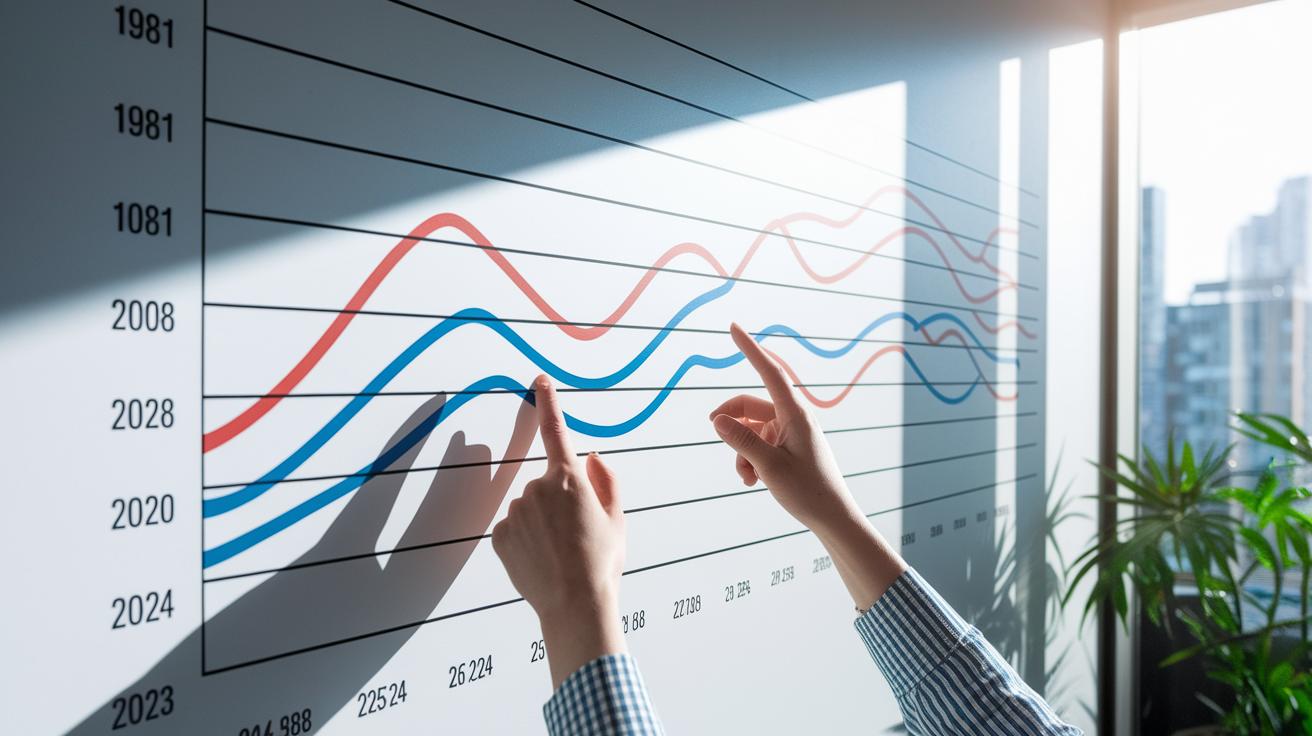
Chart data from 1977 to 2026 shows clear shifts in Treasury yields.
- In 1981, yields peaked near 15% amid high inflation and tighter monetary policy.
- Following the 2008 crisis, yields dropped below 3% as investors moved to safe assets.
- Mid-2020 saw yields fall to about 1.9% due to economic slowdown and significant fiscal support.
- By mid-2023, yields recovered to around 3.2%, reflecting renewed investor confidence.
These trends underline how inflation, economic growth, and policy decisions shape market expectations over decades. Graphs comparing these historical events with current data give investors a quick visual tool to understand how risk and growth estimates evolve over time.
30-Year Treasury Yield Fundamentals and Sample Calculation
The yield on a 30-year Treasury bond is the annual return you earn if you hold the bond until it matures. When the bond trades at its par value, the yield matches the coupon rate because the market price equals the total value of upcoming coupon payments and the principal.
• A bond trading at a discount or premium alters its yield. For example, a bond with a 2.0% coupon trading at $95 (with a par value of $100) yields about 2.15%.
• The bond’s price reflects the present value of all future coupon payments plus the principal.
• Changes in market price drive changes in yield.
• Bonds with longer maturities show greater sensitivity to yield changes due to duration.
Investors use these basics to compare returns and assess value in fixed income portfolios.
Economic Drivers of 30-Year Treasury Yield Movements

Fed policy moves directly impact the 30-year yield. When benchmark rates change, these long-term bonds adjust as investors demand better returns amid rising prices. In 2022, inflation expectations jumped from 1.8% to 3.7%, pushing yields higher and showing how macro trends shape market sentiment.
Treasury auctions also offer clues about investor appetite and fiscal strategy. Large federal bond issuances can spark supply worries and drive yields up if demand lags. Conversely, strong auction results help stabilize rates by signaling market confidence.
GDP data plays a key role too. Strong economic growth often leads to higher yields as credit tightens, while slow growth prompts a flight-to-quality that temporarily lowers yields by boosting demand for safe U.S. Treasuries.
International spreads add extra insight. U.S. yields typically carry roughly a 100 basis point risk premium over German bunds, reflecting different economic outlooks and geopolitical risks. This margin helps assess the relative value of sovereign debt.
Key drivers of the 30-year Treasury yield include:
- Federal Reserve rate changes
- Inflation surprises
- Treasury auction outcomes
- Economic growth data
- Global risk sentiment
These factors work together, keeping yields sensitive to both domestic policy and international developments. Whether a shift in monetary policy or a change in investor mood drives the market, each element shapes the evolving landscape of long-term interest rates and helps guide fixed-income investment decisions.
30 year treasury yield: Optimistic Market Pulse
Lede: The gap between the 30-year and 10-year US Treasury yields is narrowing, suggesting investors expect slower growth and lower inflation.
• Before the 2020 recession, the spread hovered around 20 bps.
• A tightening gap means investors are paying closer attention to slower long-term growth.
• A flattening yield curve shows that long-term bonds aren’t getting a much higher return, hinting at a subdued economic outlook.
• If the 10-year yield climbs higher than the 30-year, it may signal increased recession risks.
The difference between the 30- and 10-year yields acts as a quick economic barometer. When this gap shrinks, it reflects a cautious investor stance on future economic expansion. In other words, investors are less convinced that long-term returns will justify the risk, which typically points to softer growth and lower inflation pressures.
When yields for shorter-term bonds start matching those for longer-term bonds, it shows that the extra risk of holding long-term debt isn’t being rewarded. This flattening pattern is a subtle warning that the market expects lower inflation or slower economic activity.
On the flip side, if the yield curve inverts, where the 10-year yield overtakes the 30-year, it historically signals potential recessionary pressure. Past instances show that such inversions often come before economic downturns, alerting investors to adjust their fixed-income strategies.
30 year treasury yield: Optimistic Market Pulse
30-year Treasury yields edge higher as forecasts suggest modest economic improvement amid inflation worries.
• Macrotrends projects a median yield of 3.5% by December 2024.
• Wells Fargo anticipates a slightly higher yield of 3.8% by year-end.
• Median forecasts have risen about 50 basis points over the past 12 months.
• Analysts expect an additional uptick of roughly 20 basis points in the near term.
Macrotrends now expects the 30-year yield to hit around 3.5% by December 2024, while Wells Fargo’s model shows a slightly higher forecast of 3.8%. These projections reveal that investors are balancing ongoing inflation concerns with forecasts for modest economic growth.
Over the last 12 months, median yield forecasts have increased by about 50 basis points. This steady rise reflects adjustments by market watchers as they factor in evolving economic data and the lingering effects of earlier Fed policies.
Even without new rate hikes from the Fed, market commentary indicates that yields could rise by an additional 20 basis points soon. Such a move would subtly shift bond prices and influence fixed-income strategies for many investors.
Together, the insights from Macrotrends and Wells Fargo, and the ongoing forecast updates, show that while caution remains high, there is a cautious optimism about the future, backed by a gradual upward trend in long-term yields.
Strategies and Risks for Investing in 30-Year Treasury Bonds
Investors in the 30-year Treasury market face both rewards and risks. A 1% rise in interest rates can drop bond prices by 18–20% due to its duration of about 18, making these bonds highly sensitive to rate changes.
• Prices may fall sharply with rate hikes.
• Sudden market events can quickly shift yields despite low sovereign risk.
• Managing both duration and yield spread risks is key.
Investors can employ several practical strategies:
• A laddered maturity structure spreads out exposure, lessening the effect of abrupt rate moves.
• A barbell allocation mixes short-term securities with long-term bonds to balance yield and volatility.
• Focusing on bullet maturities targets a specific investment horizon, reducing uncertainty.
• Treasury futures can be used to hedge positions against adverse interest rate shifts.
These methods help market participants adjust fixed income portfolios to maintain stable returns even when yields change rapidly.
Final Words
In the action, we unraveled the technical and historical context of the 30 year treasury yield.
We examined its calculation, key milestones and the economic factors driving its movements.
We also explored yield spreads, forecast models and investment strategies against a backdrop of risks.
These insights help you understand market shifts and make quick, informed decisions in bond investing.
With clear numbers and straightforward analysis, this rundown empowers you to see how the 30 year treasury yield impacts both the market and your portfolio.
Stay focused and trade with confidence.
FAQ
Q: What does a 30 Year Treasury yield chart show?
A: A 30 Year Treasury yield chart shows both historical and current annualized returns on 30-year U.S. government bonds, reflecting market views on long-term interest rates, inflation, and economic growth.
Q: What is the 30 Year Treasury yield curve?
A: The 30 Year Treasury yield curve plots yields across various maturities, comparing long-term rates with shorter-term bonds to reveal market sentiment about future economic conditions.
Q: What does the 30 Year Treasury yield mean?
A: The 30 Year Treasury yield represents the annualized return on U.S. government debt maturing in 30 years, capturing expectations for inflation, economic growth, and overall market risk.
Q: How can one view the 30-Year Treasury Yield chart history?
A: The 30-Year Treasury Yield chart history displays data from 1977 onward, highlighting significant peaks and troughs that correspond to major economic shifts and policy decisions.
Q: What is the 30-Year Treasury Yield FRED?
A: The 30-Year Treasury Yield FRED refers to the yield data maintained by the Federal Reserve Economic Data, providing a reliable source for historical trends and detailed market analysis.
Q: Where can I find 30-year Treasury yield data online?
A: Online platforms such as Bloomberg, TradingView, and Reddit, along with the FRED website, offer comprehensive data, charts, and discussions on the 30-year Treasury yield for informed analysis.
Q: What is the current 30-year Treasury rate?
A: The current 30-year Treasury rate is reported by market data platforms and reflects the yield on new U.S. 30-year bonds, adjusting in real time to prevailing economic conditions.
Q: Why would investors buy a 30-year Treasury?
A: Investors buy 30-year Treasuries to secure long-term income, diversify their portfolios, and benefit from the safety of government debt, even though these bonds are sensitive to interest rate changes.
Q: What bonds are paying 9% interest?
A: Bonds offering 9% interest are typically high-yield corporate or municipal issues; U.S. government bonds like 30-year Treasuries generally yield lower due to their lower credit risk.
Q: How much is a 30-year-old $100 bond worth?
A: The value of a 30-year-old $100 bond depends on its coupon rate, remaining interest payments, and current market yields, with pricing adjustments reflecting these factors in the secondary market.