


Five-Year Treasury Yields Boost Investment Hopes
The five-year Treasury rate is rising as borrowing costs shift, sparking fresh investor interest.
• Yields offer a real-time snapshot of borrowing costs and market sentiment.
• Past cycles, from 1980s high inflation to stable 2000s returns, provide useful context.
• Current trends hint at a more positive yield outlook.
Traders have seen unexpected price moves before, and today's fixed-income market could be no different. The five-year Treasury rate, adjusted for active securities, quickly reflects market sentiment and current borrowing costs. Historical shifts add weight to the idea that these trends might signal untapped investment potential. Keep an eye on this benchmark for clues on where the market could be headed.
5 year treasury rate: Positive Yield Outlook
The five-year Treasury yield is a key benchmark for fixed-income markets. The U.S. Treasury publishes the rate daily using closing market-bid yields from active securities, then adjusts the yield to a constant five-year maturity for easy comparison.
• It updates every day to reflect real-time market conditions.
• It uses actively traded U.S. Treasury securities for its calculations.
• It applies a standard maturity adjustment to track yield movements over time.
This clear measure helps investors, traders, and financial professionals assess borrowing costs and economic expectations. By tracking these trends, market participants can make informed decisions about portfolio positions and risk.
Historical Trend Analysis of Five-Year Treasury Yields

The five-year U.S. Treasury yields, from 1962 to 2026, reveal clear cycles in market behavior. In the early 1980s, yields surged above 10% as high inflation and strict monetary policy pushed rates upward. This spike became a key benchmark for fixed-income investors.
By the early 2000s, easing inflation and more stable economic conditions brought yields down, paving the way for moderate returns over the following decade. Annotated charts from this period show pronounced peaks and smooth declines that give a visual sense of these market shifts.
| Period | Trend Description | Estimated Yield Range |
|---|---|---|
| Early 1980s | High inflation and tight monetary policy | Above 10% |
| Early 2000s | Economic stabilization and easing inflation | Near 3%-4% |
| Post-2020 | Renewed economic activity leading to higher yields | Rising trend |
The charts also highlight key turning points that mark shifts in market sentiment and policy. For example, annotations note that the early 1980s spike reflected efforts to rein in inflation. Understanding these trends helps investors gauge how past economic forces influenced yields and shapes expectations for future rate movements.
Forecast Models and Projections for the 5-Year Treasury Rate
The main forecast model for the 5-year Treasury rate updates each day. It uses current yield data and futures prices to determine the median market expectation for the next quarter. The model combines recent trading activity with signals from the futures market to provide clear, actionable insights.
Forecast snapshots from past dates let analysts compare earlier predictions with later results. They record how expectations changed when traders and economists updated their views. Rolling prediction histories track trends for a single target period over successive days, allowing investors to see shifting sentiment and fine-tune risk assessments.
• The model merges daily yield data with futures signals.
• Past snapshots reveal changes in market expectations.
• Rolling histories offer a trend view for fixed maturities.
• Projections hint at future policy moves and economic shifts.
Today’s output suggests a modest rate increase in the coming quarters, driven by current market dynamics and economic trends. Analysts see these forecasts as a reliable tool for planning fixed-income strategies.
Economic and Policy Factors Influencing Five-Year Treasury Yields
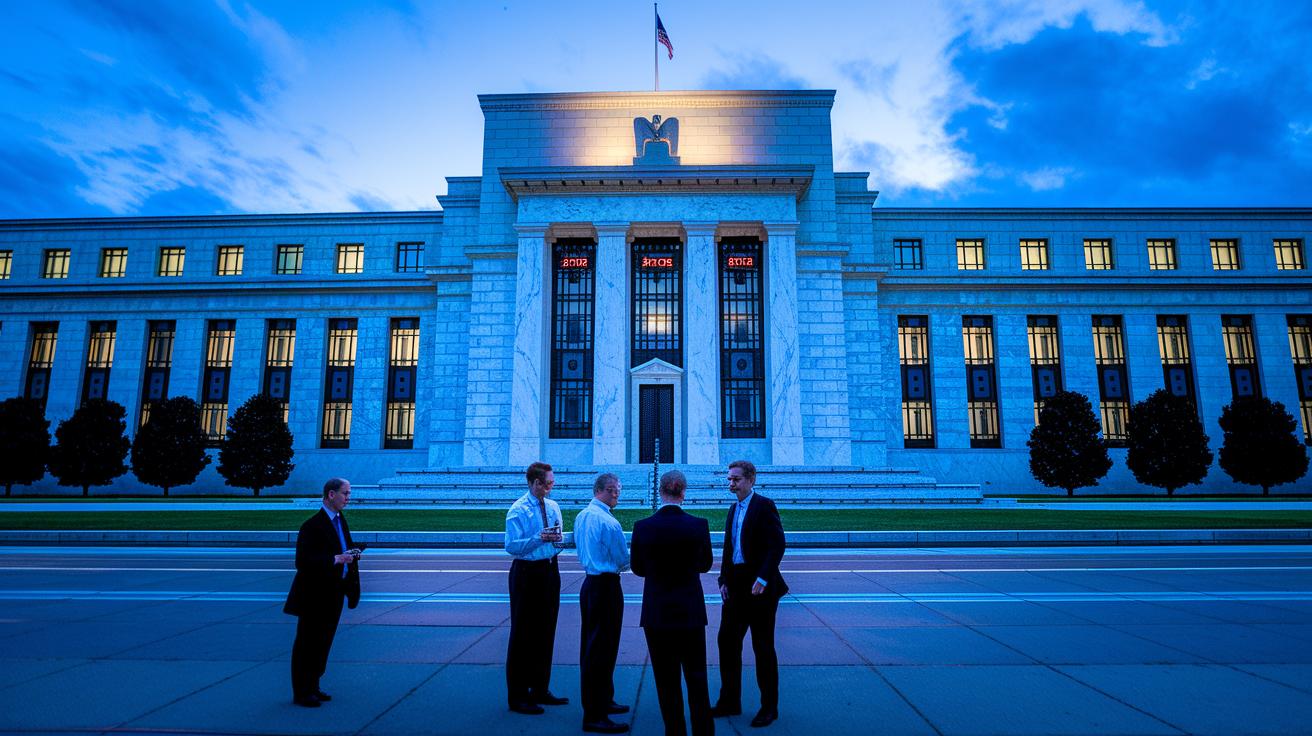
Economic forces set the five-year Treasury rate. Fed rate moves guide investor sentiment and borrowing costs. Inflation expectations, detailed in the "inflation outlook" (https://newsfinnow.com?p=872), can drive noticeable yield shifts. For instance, when inflation expectations spike, even a small policy tweak may move yields significantly. Fiscal factors like federal deficits and shifts in auction supply further affect demand for Treasuries.
Key economic numbers, such as the Consumer Price Index (CPI), GDP growth, and employment figures, shape how the Fed acts. Strong data may prompt rate hikes as the Fed balances growth with price stability. Yields tend to rise with heightened inflation worries and drop when growth slows. Traders adjust quickly based on these daily indicators.
• Fed rate moves lead to immediate yield changes.
• Inflation trends in the "inflation outlook" influence market confidence.
• Fiscal deficits and auction supply shifts affect Treasury demand.
• CPI, GDP, and employment figures provide clear market signals.
Recent reports of solid GDP growth and rising inflation expectations suggest that five-year yields may move higher. Monitoring policy decisions and economic data remains key for predicting future trends.
Comparative Yield Spread: Five-Year Versus Other Maturities
The five-year yield, when compared with both shorter and longer-term Treasuries, reveals investor expectations and hints at future policy moves.
• The gap between the five-year and two-year yields signals near-term monetary policy views.
• The spread to the ten-year yield offers insights into long-term growth expectations.
• Changes in these spreads provide clear, actionable cues on market sentiment.
The difference between the five-year and two-year yields helps gauge if rate hikes may pause. A narrow gap suggests that further tightening might slow down, while a wider spread points to steady growth and delayed rate increases.
Comparing the five-year yield with the ten-year yield shows investors' long-term outlook. A steeper curve, where the ten-year yield rises faster, indicates stronger growth potential. In contrast, a flatter curve signals caution about the economic future.
Overall, these yield spreads remain a valuable tool for investors and traders as they adjust their strategies in changing market conditions.
Investment Strategies for Five-Year Treasury Securities

Investors add five-year Treasury notes to their portfolios using a few clear strategies. One method is laddering, buying bonds with different maturity dates to spread risk and lower the chance of reinvestment issues when yields change. Barbell and bullet strategies also offer tailored options. Barbell strategies mix short- and long-term bonds for steady income and stability, while bullet strategies focus on one maturity to take advantage of mid-term yield shifts. Duration matching adjusts the portfolio's response to interest rate changes based on an investor’s risk comfort.
• Laddering cuts reinvestment risks by using bonds with varied maturities.
• Barbell strategies blend different bond lengths to balance income and security.
• Bullet strategies focus on one maturity to capture expected yield trends.
• Duration matching aligns bond sensitivity with changes in interest rates.
Investors use yield forecasts and risk checks to steer these strategies. Active portfolio management lets them change duration targets as new yield data comes in. These approaches help maintain steady fixed-income returns, make the most of five-year yield trends, and keep risk levels in line with financial goals.
Final Words
In the action, this article traced today's 5 year treasury rate through current snapshots and historical trends, forecast models, and economic drivers.
We examined yield spreads against other maturities and discussed investment strategies tailored to evolving market signals.
Each section outlined key data points that illuminate how policy and market forces shape this key benchmark.
The clear breakdown offers a focused view of trends behind the 5 year treasury rate and sets the tone for confident, informed trade decisions.
A closer look at these insights can empower your next strategic move.
FAQ
What does the 5 Year Treasury Rate chart show?
The 5 Year Treasury Rate chart displays daily and monthly yield trends for the U.S. five-year note, based on market-bid yields. It highlights historical turning points and serves as a benchmark for fixed-income evaluations.
How does the 3 Year Treasury Yield compare?
The 3 Year Treasury Yield indicates shorter-term interest trends versus the five-year rate, helping investors assess near-term market conditions and adjust their fixed-income strategies accordingly.
What does a 5 Year Treasury Rate forecast entail?
The forecast combines current yield data with futures market prices to predict future movements. It provides median market expectations for the five-year rate over upcoming quarters.
How do CNBC and WSJ report on the 5 Year Treasury Rate?
CNBC and WSJ report using U.S. Treasury and Federal Reserve data, presenting the five-year rate as a benchmark along with trend analysis to guide investors and market watchers.
What is the significance of the 4 Year Treasury Yield and U.S. Treasury Yield chart?
The 4 Year Treasury Yield and U.S. Treasury Yield chart offer insights into different fixed-income segments. They reflect economic conditions and provide useful comparisons for evaluating yield trends.
Are T bills better than savings accounts?
T bills often provide higher yields than savings accounts for risk-averse investors looking for short-term returns, though liquidity and individual financial goals should guide the choice.
How can I buy U.S. debt?
U.S. debt can be purchased directly via TreasuryDirect or through brokers and banks by buying Treasury bills, notes, and bonds, offering a straightforward way to access government securities.
Why are Treasury yields falling?
Treasury yields fall when investor demand for safe assets increases, pushing prices up. Economic slowdowns or lower inflation expectations often contribute to these declining yield trends.
What is the 5 year government bond rate?
The 5 year government bond rate represents the annual yield on a five-year U.S. Treasury note, calculated using end-of-day market data and serving as a key measure for fixed-income markets.