

Headline: Candlestick Patterns Signal Trend Shift
Lede: A long lower wick in a downtrend may indicate rising buyer strength and an impending trend shift.
• Reversal candlestick patterns can alert traders to a potential market turn.
• A long lower wick during a downtrend suggests buyers are stepping in.
• Key signals near support or resistance levels may point to winning trade setups.
Traders can use these clear price cues to make swift decisions. By spotting these patterns, you can better time your entries and exits as trends shift. Focus on the visuals, a distinct long lower wick or critical price levels could be your cue for action.
How Reversal Candlestick Patterns Work: Key Concepts
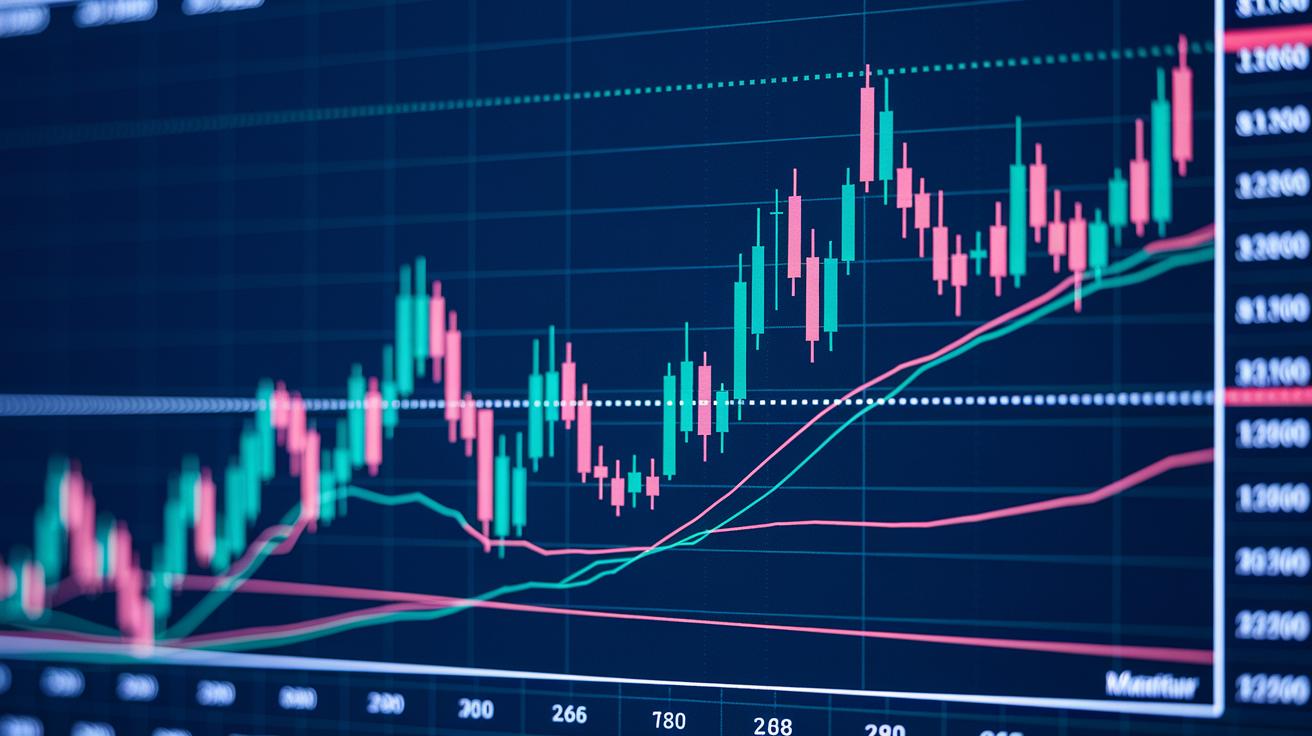
Candlesticks show key price details, open, high, low, and close, in one glance. For example, one candle might open at $50, peak at $55, drop to $48, and close at $52, giving traders a clear picture of market mood.
A reversal pattern suggests that the current trend is weakening and might change direction. It appears when candles indicate a mismatch between price moves and trader sentiment. For instance, a long lower wick in a downtrend can mean buyers are stepping in. This signal is strongest when it shows up near important support or resistance levels.
Traders wait for confirmation before acting on a reversal. They check the following candle and look at factors like trading volume, moving averages, or momentum oscillators to reduce false signals.
• The candle body marks the open-to-close range.
• The wicks show the highs and lows.
• A mismatch in these details can signal a trend shift.
Key Bullish Reversal Candlestick Patterns
Bullish reversal patterns alert traders to a shift from a downtrend to an uptrend, offering clear entry points at key support levels.
- Hammer: A small body with a long lower shadow near support. It suggests buyers are stepping in as volume rises.
- Inverted Hammer: A small body at the low end with a long upper wick. It hints that buyers could help drive prices up.
- Bullish Engulfing: A larger bullish candle follows several bearish candles near support, especially when volume is strong.
- Morning Star: A three-candle sequence where the third candle closes well into the first candle’s range, signaling a buying opportunity.
- Dragonfly Doji: With nearly equal open, high, and close plus a long lower wick, this pattern shows market uncertainty that may soon reverse.
- Piercing Line: A bearish candle is followed by a bullish candle that closes above the midpoint of the prior candle, indicating a potential turnaround.
- Three White Soldiers: Three back-to-back bullish candles, each closing higher than the last, point to a clear upward move.
These signals gain credibility with strong volume and follow-up confirmation. Traders should also check other technical indicators before making a move.
Key Bearish Reversal Candlestick Patterns
Bearish signals alert traders to potential market tops and signal that prices may soon drop. These reversal patterns are critical for setting exits and managing risk.
- Shooting Star: Forms at a market peak. The candle’s upper shadow is at least twice its body and appears near resistance with strong volume.
- Hanging Man: Looks like a hammer in an uptrend. A follow-up bearish candle confirms a top.
- Bearish Engulfing: A large bearish candle completely covers the previous smaller bullish candle, indicating strong seller control.
- Evening Star: A three-candle pattern that ends with a candle closing well below the pattern’s low. Traders often sell below this low and set stops above the pattern’s high.
- Dark Cloud Cover: Starts with a bullish candle followed by a bearish candle that closes below the midpoint of the prior candle's body, casting doubt on the uptrend.
- Bearish Abandoned Baby: A rare three-candle setup that begins with a gap up, then a gap down, signaling a sharp bearish reversal.
- Three Black Crows: Consists of three bearish candles in a row, each closing lower than its predecessor. Studies have noted a performance sum of about 60% in these setups.
Traders should confirm these patterns with high volume and other technical indicators like moving averages or momentum oscillators. Validate the reversal with the next candle before entering a trade. Tight stop-loss orders set beyond the pattern’s extreme points and proper position sizing help control risks when these bearish signs show up.
Step-by-Step Guide to Identifying Reversal Candlestick Patterns
Start by scanning your chart for potential reversal signals at key support and resistance levels. Look for unusual candlestick shapes, like long shadows or engulfing patterns, that break from the current trend. This initial review helps sift out market noise and spot areas where a shift in momentum might be forming. For example, a group of candles near a strong support zone can suggest that buyers may soon step in.
Next, check the trading volume tied to the pattern. Heavy volume typically confirms a reversal by showing that more traders back the move. A candlestick reversal with higher-than-average volume indicates that sentiment could be shifting noticeably. Observing volume spikes on patterns like a hammer or bullish engulfing adds extra confidence to the signal.
Finally, validate the candlestick pattern using other technical indicators. Tools like the relative strength index (RSI) divergence or moving average crossovers can reveal if a momentum change backs the pattern. Testing the pattern around key support or resistance areas further ensures that the signal is genuine and part of a broader trend change.
| Technique | Indicator | Purpose |
|---|---|---|
| Volume Analysis | Trading Volume | Confirm strength of reversal |
| RSI Divergence | Relative Strength Index | Identify momentum shifts |
| Moving Averages Crossover | Simple/Exponential MA | Spot trend changes |
| Support/Resistance Test | Price Levels | Validate key reversal zones |
Real-World Reversal Candlestick Pattern Examples
In forex trading, the EUR/JPY chart shows a Bullish Engulfing pattern at a key multi-month support level. After several bearish candles, a large bullish candle completely covers them, signaling that buyers are starting to take control after a long downtrend. High volume confirmed the pattern, and many traders entered long positions after a confirming candle to lower risk and capture the upward move.
On the daily chart for Apple Inc. (AAPL), an Evening Star pattern led to a 3% pullback. The pattern appeared after a steady uptrend when a bearish candle closed well below previous support near key resistance. This setup indicated that buying pressure was fading, prompting traders to shorten positions or reduce their long exposures in anticipation of a further correction.
In commodities, a Shooting Star pattern on Gold’s 1-hour chart preceded a $15 decline. The candle had a very small body with an upper shadow at least twice its size, forming at the peak of an intraday rally near established resistance. Increased selling volume validated this reversal signal, allowing traders to exit positions or short the asset to benefit from the drop.
Risk Management for Reversal Candlestick Patterns
Traders use stop-loss orders placed just outside the reversal pattern to limit losses. For a bullish signal, they set stops slightly below the pattern’s low; for a bearish signal, just above the pattern’s high. This method helps control risk during volatile moves and keeps individual trade risk to 2% or less of total capital.
• Stops are placed right outside the pattern’s extreme.
• Limiting risk to 2% of capital shields your portfolio if conditions change fast.
A clear take-profit target is equally important. Many aim for a profit level at least twice the distance from the entry to the stop-loss, which establishes a strong risk-reward balance and helps maintain trading discipline.
• Target profits set at double the stop-loss distance improve the risk-reward ratio.
• A defined profit target can prevent premature exits during short-term fluctuations.
Adjusting position size based on the strength of the reversal pattern is another key factor. When volume or other technical signals confirm the pattern, traders may increase their position within safe risk limits. Weaker signals call for smaller positions to protect capital if the trade doesn’t move as expected.
• Increase position size when technical factors confirm the pattern.
• Use smaller allocations for less confirmed signals to preserve capital.
Advanced Reversal Candlestick Pattern Techniques
Automated pattern detection is changing how traders read charts. These tools use algorithms to scan huge amounts of data in real time, cutting down on human mistakes and speeding up signal detection.
• LuxAlgo’s Reversal Candlestick Structure indicator picks up seven main patterns and nine extra setups with dynamic color coding.
• A built-in stochastic oscillator works with automated dashboards to confirm momentum changes and cut false signals.
• Backtests show success rates of 67% to 79%, proving that a data-driven approach can boost trade outcomes.
This mix of candlestick signals and oscillators helps traders spot trend changes quickly, even in volatile markets. Using historical data to fine-tune strategies ensures traders focus on setups with the best risk-to-reward profiles.
Final Words
In the action, the article broke down the basics of reversal candlestick patterns explained, covering everything from identifying trend reversals to applying real-world examples. We discussed both bullish and bearish setups, offered a guide for pattern confirmation, and stressed risk management principles.
These insights provide clear signals for making confident, tradeable moves in today’s market. Stay focused and use these tools to spot key turning points, making your next trade a smart, well-informed decision.
FAQ
How are reversal candlestick patterns explained and what do they indicate?
Reversal candlestick patterns describe formations using open, high, low, and close prices that suggest a trend’s momentum is weakening. These patterns, including bullish and bearish setups, help traders spot potential turning points.
How does a downtrend reversal candle signal a turning point?
A downtrend reversal candle forms at a low point in a decline. Its pattern shows that sellers are losing power, and buyers might be stepping in, indicating an early sign of a potential upward shift.
What is considered the best reversal pattern?
The best reversal pattern varies by context, but patterns like bullish engulfing or bearish engulfing at key support or resistance levels often offer strong signals when paired with volume and confirmation from subsequent candles.
What is an outside candle pattern and why is it significant?
An outside candle pattern occurs when a candle completely engulfs the previous candle’s range. This formation signals a significant shift in market sentiment and can mark the beginning of a reversal in the current trend.
What reversal patterns should traders look for in XAU/USD?
In XAU/USD, traders monitor reversal patterns such as the shooting star and hammer. These setups, confirmed by volume and additional technical indicators, help signal potential trend changes in this volatile market.
What is the strongest reversal candle pattern?
The strongest reversal candle pattern depends on context, but many traders find that a bullish or bearish engulfing pattern at a critical support or resistance area provides a powerful signal when confirmed by subsequent price action.
How do you read a reversal candle?
Reading a reversal candle involves examining its open, high, low, and close, noting long wicks or small bodies that appear at market extremes. Such details, especially at support or resistance levels, indicate a possible trend change.
What does the 3 candle rule mean in reversal trading?
The 3 candle rule refers to confirming a reversal when three consecutive candles show a consistent change in direction. This sequence adds reliability to the signal, increasing confidence in a potential trend reversal.
Is reversal trading profitable?
Reversal trading can be profitable if patterns are confirmed by volume and other technical indicators. However, managing risk through stop-loss orders and proper trade sizing remains crucial since market reversals always carry inherent uncertainty.