


USD Index Signals Market Pulse
- Tracks the U.S. dollar against six major currencies.
- Computed using weighted trade data.
- Offers real-time insight into investor sentiment.
The USD Index acts as a quick gauge of market conditions. Its calculated weights help traders and analysts spot shifts in sentiment and adjust strategies on the fly. Keeping an eye on these movements gives you a clearer view of economic health and emerging trends.
Understanding the USD Index: Definition and Significance
The U.S. Dollar Index is a key gauge that shows how the dollar is performing against six major currencies. It uses a weighted geometric mean to track exchange rate changes, offering a quick snapshot of dollar strength or weakness that matters for both short-term market moves and long-term trends.
• Measures the dollar against the euro, Japanese yen, British pound, Canadian dollar, Swedish krona, and Swiss franc
• Weights: Euro 57.6%, Yen 13.6%, GBP 11.9%, CAD 9.1%, SEK 4.2%, and CHF 3.6%
• A softer euro, due to its strong weight, can push the index higher even if other currencies change little
Traders and analysts rely on the index to assess investor sentiment, export competitiveness, and the overall health of the U.S. economy. A rising index typically indicates a stronger dollar, which can impact commodity prices, stocks, and trade flows. Quick climbs in the index may prompt adjustments in positions in currency-sensitive markets, making the USD Index a trusted, real-time benchmark for global financial conditions.
Composition and Calculation of the USD Index

The USD Index is built using a weighted geometric mean that reduces the impact of extreme currency moves. Its formula is 50.14348112 × EUR^(–0.576) × JPY^(–0.136) × GBP^(–0.119) × CAD^(–0.091) × SEK^(–0.042) × CHF^(–0.036). The weights come from U.S. trade data with each currency region.
- It uses real trade flows to set each currency’s weight.
- This method helps keep the index balanced even when one currency moves sharply.
| Currency | Weight (%) |
|---|---|
| EUR | 57.6% |
| JPY | 13.6% |
| GBP | 11.9% |
| CAD | 9.1% |
| SEK | 4.2% |
| CHF | 3.6% |
This calculation mirrors actual trade flows, giving investors a dependable measure of the dollar’s strength that adjusts with market changes.
Historical Performance of the USD Index (2006–2025)
The USD Index tracks the dollar’s strength from 2006 to 2025 by adjusting for inflation differences among major currencies. This price-adjusted view gives a clearer picture of true market performance.
• In 2008, during the financial crisis, the index fell below 72 as market uncertainty grew.
• A rally in 2014–2015 pushed the index past 100 when a weakening euro helped boost the greenback.
• In 2020, safe-haven demand amid the COVID-19 crisis moved the index close to 103.
• Continued Federal Reserve tightening in 2022 lifted the index to a peak of 114.78.
These key points show how global shocks and U.S. monetary policy have shaped the dollar's long-term trend. Investors can use interactive charts and full datasets to analyze these historical trends further.
Key Influences on the USD Index: Economic and Policy Drivers

The USD Index moves as investors react to changes in economic policy and global events. A mix of Fed decisions, inflation reports, trade balances, and market sentiment shifts the index quickly.
- Fed actions: Changes to interest rates affect borrowing costs and drive demand for the dollar.
- Inflation differences: Variations in U.S. inflation versus other countries adjust purchasing power and influence currency values.
- Trade deficits: Rising U.S. trade deficits can weigh on the dollar by highlighting imbalances in international trade.
- Geopolitical risks: Political uncertainty and global crises push investors toward the dollar as a safe asset.
- Commodity swings: Shifts in prices, especially oil, can move funds between assets and impact the dollar’s strength.
- Market mood: Changes in investor confidence and risk appetite can quickly alter demand for the dollar.
These factors work together in real time. A surprise Fed rate change might lower safe-haven buying one minute and then, when geopolitical issues flare up, lift the index the next. Monitoring these indicators helps traders and policymakers adjust their strategies as conditions evolve.
USD Index in Trading and Forecasting Strategies
Traders rely on real-time charts to spot trading opportunities in the USD Index. Using platforms like TradingView, they mark support and resistance levels to quickly decide when to enter or exit a trade.
- Charts show clear trend lines and technical patterns.
- Sentiment indicators help gauge forex mood.
- A pullback toward a known support level may signal a possible reversal.
- Futures contracts offer insight into upcoming market shifts.
In practice, traders watch for brief pullbacks at key price levels to make quick decisions. Alongside technical charts, USD futures data, such as open interest and trading volume, provide an early glimpse of potential market moves. Analysts also factor in GDP growth, interest rate trends, and commodity cycles when forecasting the index. Recent Fed forecasts and CFTC net positioning metrics underline the impact of monetary policy on the USD Index. This mix of chart analysis and futures insights helps traders adjust their strategies swiftly in a fast-moving market.
Technical Analysis of the USD Index: Patterns and Volatility
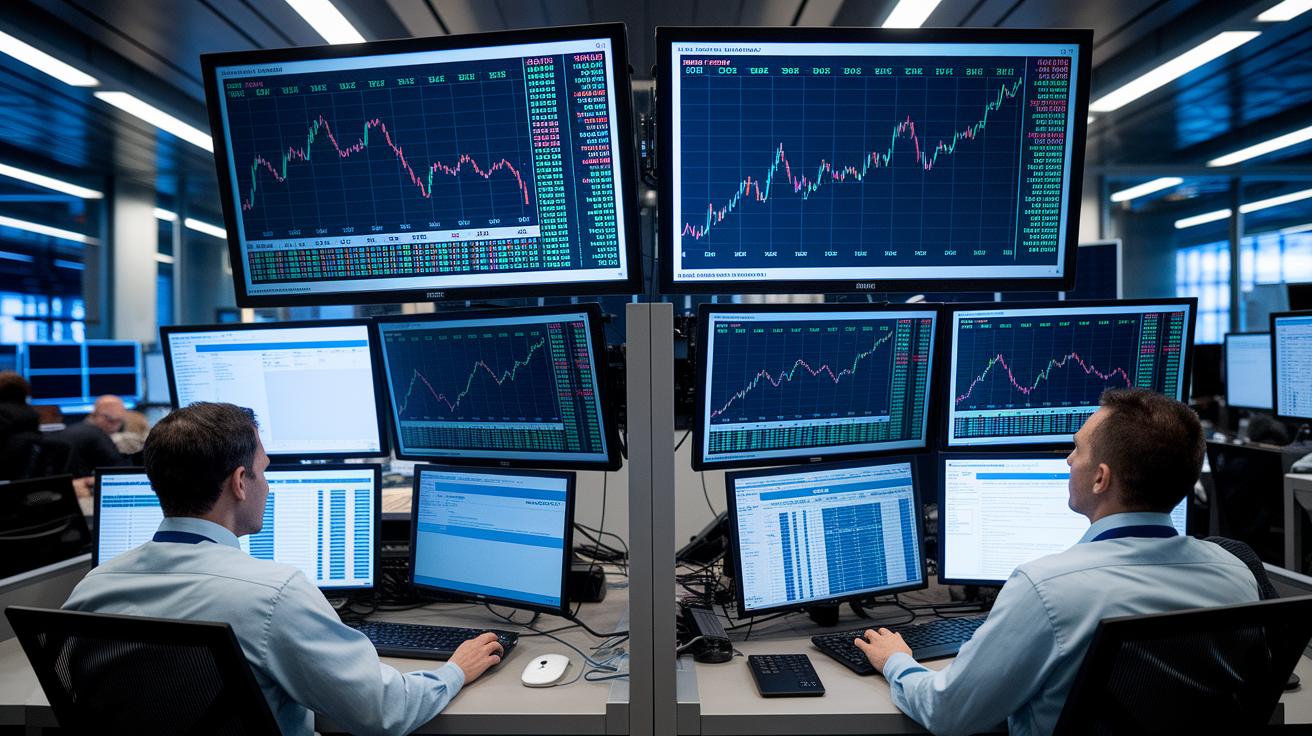
Traders watch chart patterns to track the USD Index. Formations like head & shoulders, double tops, and trendline breaks help signal possible reversals or moves that continue the trend. For example, a clear head & shoulders pattern may indicate a reversal, prompting traders to adjust their positions. Similarly, double tops and bottoms show where resistance or support exists, confirming market sentiment.
• Chart patterns guide quick interpretations in volatile conditions.
• A head & shoulders setup often signals a reversal in the index.
• Double tops and bottoms help pinpoint key support and resistance levels.
Volatility measures add another layer of insight. Tools like the Average True Range (ATR) and a VIX-like USDVX index track market fluctuations. Seasonal trends also play a role; Q4 frequently sees volatility spikes as year-end adjustments occur. A sudden ATR rise during Q4 may alert traders to brace for sharper market swings.
By blending pattern analysis with volatility measurements, traders gain a clearer view of market dynamics and can adapt their strategies swiftly.
Strategic Applications of the USD Index in Portfolio Management
Investors rely on the USD Index to guard against foreign exchange risks. When portfolios include assets in other currencies, a rising index can help counter losses from a falling currency value. For example, if international bonds drop in value due to currency moves, a stronger dollar can lessen the loss. This built-in hedge protects portfolios and boosts confidence during global market swings.
Traders also use the index to guide portfolio rebalancing. They watch shifts in the USD Index to decide when to adjust currency positions. A noticeable rise might prompt a shift toward commodities like gold or oil, given that these assets often move inversely to the dollar. This approach helps investors keep a balanced mix of assets as market conditions change.
During different market moods, the USD Index signals overall market sentiment. In risk-off periods, a stronger dollar often indicates less liquidity worldwide, leading investors to shift toward safer assets. This quick reaction to index changes aids both large institutions and individual investors in managing market uncertainty.
Final Words
In the action, we broke down how the usd index measures the dollar against key currencies. We explained its calculation, components, and the role of weights in reflecting trade flows. We also covered the index’s historical trends, economic drivers, and how technical patterns guide trading signals. This quick review connects policy drivers to portfolio strategies, helping traders see tradeable opportunities. The discussion offers clear markers for those watching price moves and economic shifts. Positive market moves can emerge from understanding these real-time cues.
FAQ
How can I view live charts and trends for the USD Index?
The query about live charts means you can use platforms that offer real-time interactive displays showing the USD Index, including forecasts, trend data, and futures figures, all useful for active trading insights.
What is the current USD Index reading?
The query regarding the current reading indicates that the USD Index is updated continuously and reflects the dollar’s value against a weighted basket of six major currencies during trading hours.
What does the USD Index mean?
The query about the USD Index means it measures the U.S. dollar’s strength against six key global currencies using a weighted average, serving as a benchmark for assessing relative currency value.
Why is the USD dropping?
The query concerning a dropping USD indicates that falling readings can result from shifts in economic data, Federal Reserve policies, and market sentiment, impacting investor confidence and trade balances.