
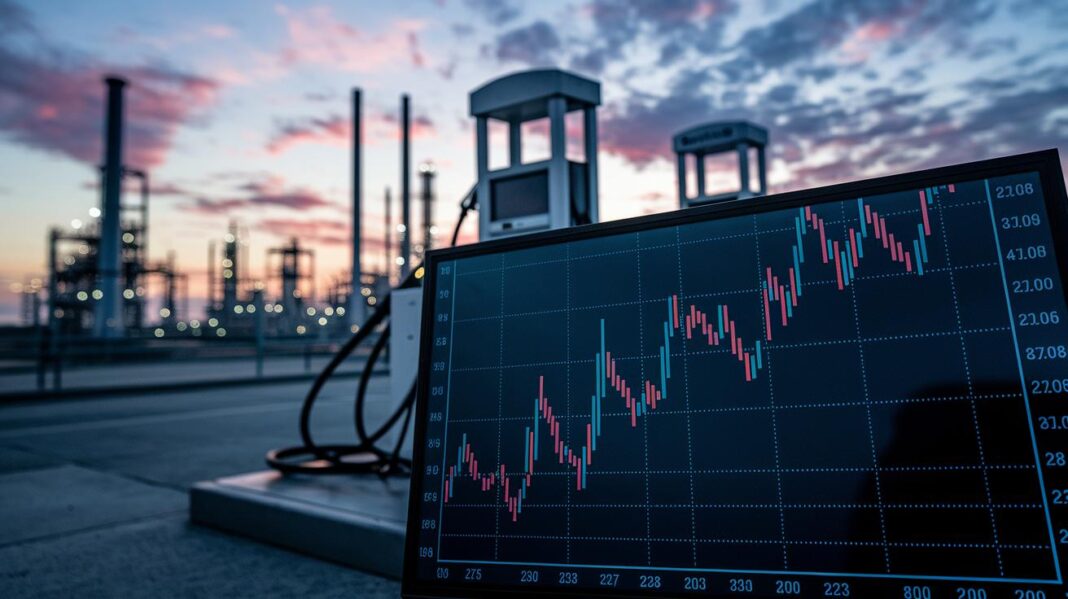

Oil and Gas Prices: 3 Key Cycles Drive Market Moves
Oil and gas prices move in three clear cycles that investors watch closely.
- Demand spikes and tighter supply push prices higher.
- When supply catches up, prices drop.
- Geopolitical events can make these swings even more pronounced.
These cycles set the stage for market trends. Traders use this pattern to manage risk and find opportunities. Understanding these cycles can help you act quickly in a fast-moving market.
Key Dynamics Behind Cycles in Oil and Gas Prices
Oil and gas prices follow regular cycles driven by changing market fundamentals. These cycles help investors and traders spot opportunities to buy when prices are low and sell when they peak. Understanding these moves is key to managing risk and positioning in a volatile market.
• Prices rise when demand climbs or supply tightens, and fall when supply exceeds demand.
• Geopolitical events like conflicts or sanctions can suddenly disrupt supply and push prices higher.
• Speculative trading and market sentiment often add momentum to these price swings.
• Fluctuations in the U.S. dollar influence global demand and affect price levels.
Price cycles can last several years. Some cycles see moderate price changes, while others respond to sudden market shocks. Recognizing these patterns helps traders time their investments and hedge against potential downturns.
Historical Trends and Past Cycles in Oil and Gas Prices
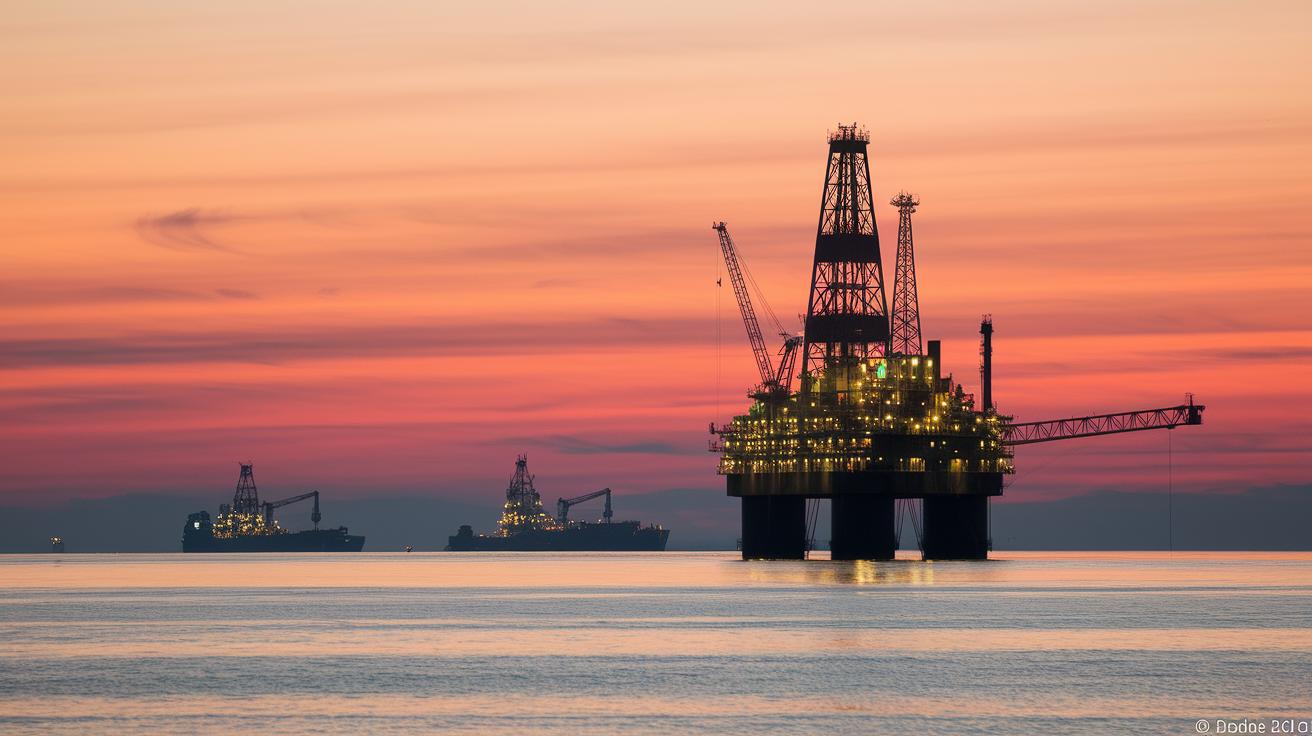
Oil and gas cycles shape the energy market. In 1939, the Seminole field boom sparked rapid price increases thanks to new drilling techniques. These early cycles set trends that traders still watch today.
• The 1939 boom pushed prices higher with aggressive drilling.
• Mid-20th century cycles saw prices swing with supply shocks and demand surges.
• In 2020, the COVID-19 crisis cut prices by 60%, then a 50% rebound followed in 2021 as demand outpaced supply.
• Forecasts show oil demand could hit 103 million barrels daily by 2025, giving context to today’s market moves.
These historical trends matter because they show how the market reacts to shifts in supply and demand. Knowing the past helps investors manage risks and spot opportunities now.
| Year | Event | Price Impact |
|---|---|---|
| 1939 | Seminole drilling boom | Sharp price rise |
| 1973–74 | OPEC oil embargo | Sustained spike |
| 2020 | COVID-19 demand crash | 60% price drop |
| 2021 | Post-pandemic recovery | 50% rebound |
Supply and Demand Dynamics Shaping Oil and Gas Price Cycles
Oil and gas prices swing when supply and demand shift. Prices fall when supply overshoots demand and rise when buyers outpace available fuel.
• Prices drop with excess supply and rise with high demand.
• Fossil fuels made up about 84% of U.S. energy production in 2023, so even small supply or consumption changes can create noticeable price swings.
• Factors like domestic shale surges and OPEC’s production cuts play a big role in short-run market cycles.
• Seasonal trends and industrial growth also drive demand, adding to price volatility.
Supply-side moves affect the market directly. Domestic shale production can lead to temporary oversupply that pushes prices lower, while coordinated production cuts, especially by OPEC, help stabilize or raise them. U.S. export capacity and global strategies further influence the available supply, highlighting that even brief supply mismatches can shift market dynamics.
Demand factors also have a strong impact. Industrial expansion boosts energy use as factories ramp up production, and predictable seasonal changes like winter heating or summer cooling spur demand spikes. Global economic growth adds to this trend, meaning even modest changes in energy needs can lead to significant price movements.
| Factor | Effect on Prices |
|---|---|
| Excess Supply | Lower prices |
| Coordinated Production Cuts | Higher prices |
| Industrial Growth & Seasonal Demand | Price spikes |
Geopolitical and Speculative Influences on Oil and Gas Price Cycles

Unexpected sanctions and regional conflicts are straining oil supplies. In the Eastern Mediterranean, pipeline operators re-routed shipments as tensions rose, adding a new layer of risk to an already volatile market. Traders are watching closely as production disruptions trigger rapid price shifts.
• Eastern Mediterranean tensions force shipment reroutes.
• Supply gaps are sparking fast market moves.
• Nearly 40% of crude futures volume came from automated trades during key price shifts.
Algorithm-driven trading is amplifying these movements further. Automated models now respond quickly to changes in U.S. dollar strength, driving prices higher faster than seen in previous cycles. Last week, nearly 40% of the trading volume in crude futures came from these automated systems, reflecting a shift in market sentiment.
Seasonal Demand Drivers and Price Variability
Seasonal trends in the oil and gas market drive clear price changes. In the summer, more travel boosts gasoline use, while winter's cold increases demand for heating fuel. At times, delays in restocking inventories further tighten supply, which can lead to sharp price jumps. This behavior ties back to our earlier look at supply and demand patterns, showing how even small disruptions can move prices significantly.
Growing baseline demand makes these seasonal shifts even more noticeable. When supply is briefly delayed in a market with rising consumption, the effect on both spot and futures prices becomes stronger. Traders and analysts should keep a close eye on these seasonal trends, as they play a key role in overall market pricing. For more on how long-term growth interacts with short-term supply hiccups, refer to the Supply and Demand Dynamics section.
Technical Analysis and Forecasting Future Cycles in Oil and Gas Prices

Forecasting helps traders and risk managers catch key market moves. By spotting cycle changes, they adjust hedging strategies and protect their portfolios. Traders expect price surges during tight supply and dips when there’s oversupply.
• Accurate forecasts let traders act before volatility strikes.
• Technical tools turn past trends into clear, usable insights.
• Cycle lengths vary, from years-long trends to short, volatile changes.
Traders build models using many data points. They analyze historical prices, volume, and sentiment using tools like moving averages, momentum indicators, and cycle regression models. These signals help pinpoint when demand peaks or oversupply begins.
A strong forecast model combines several technical indicators to smooth out data glitches and give a clear view of the market. Key elements include:
- 50/200-day moving average crossovers
- Relative Strength Index (RSI) divergences
- MACD histogram cycles
- Price momentum with volume spikes
- Cycle regression or Fourier analysis
Merging these tools gives traders a comprehensive look at market cycles and improves prediction accuracy. This integrated approach supports both short-term trades and long-term risk management strategies.
Outlook on Future Trends and Potential Shifts in Oil and Gas Cycles
U.S. policy is reshaping oil and gas cycles through expanded leasing and quicker permit processes that keep domestic production steady. New infrastructure investments and updated exploration methods, especially in shale, are easing operational delays that once made market swings more extreme. These changes could smooth out cycle highs and lows or, in some cases, set the stage for sharper price moves as global conditions shift. Despite the rise in renewables, steady domestic output remains a key support amid global pressures.
• Domestic policies boost production stability with faster permits and more leasing.
• Modern investments and shale techniques reduce past bottlenecks.
• Changes may either dampen or intensify price swings, depending on global market responses.
• Even as renewables grow, consistent U.S. output anchors market confidence.
Emerging technologies are also set to alter oil and gas cycles further. Advancements like improved analytics and carbon capture are enhancing efficiency and environmental outcomes, providing new insights that may shorten or lessen cycle extremes. Meanwhile, economic growth is expected to push oil demand past 103 million barrels per day by 2025. This strong, ongoing demand, paired with continued tech progress, suggests future cycles might have softer peaks while keeping a baseline of volatility. Overall, evolving policies, tech breakthroughs, and solid market fundamentals will drive the next phase of energy price trends.
Final Words
In the action, we explored the driving forces behind cycles in oil and gas prices, dissecting how supply–demand dynamics, geopolitical events, speculative trading, and seasonal demand shifts shape market trends.
We walked through historical booms and busts, examined technical tools for forecasting, and discussed policy and technology influences on future cycles.
This clear breakdown empowers swift market decisions and points to a brighter outlook for navigating these fluctuating cycles.
FAQ
Frequently Asked Questions
What do cycles in oil and gas prices graphs and charts show?
The cycles in oil and gas prices graphs and charts show recurring price swings driven by supply-demand balances, geopolitical events, market speculation, and seasonal patterns. They help investors anticipate future volatility.
How did oil and gas price cycles look in 2022?
The cycles in oil and gas prices in 2022 reflect significant volatility amid supply shifts, geopolitical tensions, and market sentiment changes. They provided important clues about market dynamics throughout that year.
What is the oil price cycle?
The oil price cycle is the pattern of periodic rises and falls in crude oil prices influenced by demand changes, supply disruptions, speculative trading, and currency movements. It guides market participants in forecasting trends.
What is gas price cycling?
Gas price cycling refers to the regular fluctuations in natural gas prices driven by variations in supply and demand, seasonal usage shifts, and market sentiment. These cycles help traders manage risk and timing.
Is the oil and gas industry cyclical?
The oil and gas industry is cyclical, experiencing regular phases of expansion and contraction. This cycle is shaped by shifting supply-demand dynamics, geopolitical events, and seasonal influences that affect pricing.
Why are crude oil prices dropping?
The drop in crude oil prices arises from factors such as oversupply, reduced demand, and currency strength shifts that lower international competitiveness. These factors contribute to downward price pressures in the market.