

Market Crash Opens Doors for Smarter Investing
Investors see opportunity in sudden market dips that boost long-term growth.
• Stock drops may offer a chance to buy.
• History shows major downturns are rare and often lead to rebounds.
• Cautious investors can improve portfolios through diversification and rebalancing.
Sharp declines in stocks can trigger worry, but they also set the stage for strategic moves. Past market crashes eventually led to recoveries, giving investors the chance to rebalance and diversify. This cycle shows that a downturn might clear the way for a smarter, more resilient investment approach.
Market Crash Explained: Definition, Scope, Historical Frequency
A market crash is a sudden, steep drop in stock prices after a period of gains. It hits quickly and catches investors off guard.
• On a normal day, the S&P 500 moves between -1% and +1%.
• A 7% drop in one day triggers a 15-minute halt to trading.
• About 7% of 12‐month periods see losses of 30% or more.
• In 100 years, roughly 10 severe downturns have been recorded.
Understanding these numbers shows the difference between everyday market moves and rare, sharp downturns. Knowing that extreme crashes are uncommon helps investors stay calm. It also supports strategies like portfolio diversification and thoughtful rebalancing when markets dip.
Underlying Causes of a Market Crash

A market crash can follow when prices rise well above real value and panic sets in. Key drivers include:
• Speculative bubbles pushing prices too high
• Sudden changes in monetary policy
• Panicked selling that deepens declines
Speculative bubbles emerge when investors pile into stocks during optimistic runs. The current AI surge mirrors past excesses, like before the 1929 crash, where prices soared far beyond true worth. This mismatch can lead to a dramatic pullback that rattles investor confidence.
Likewise, swift moves in monetary policy, such as unexpected rate hikes or shifts in cash flow, can unsettle markets used to easy money. These rapid changes force investors to rethink their positions, increasing the risk of a sharp, heavy correction.
Investor behavior adds fuel to the fire. Quick, frightened selling can turn a small dip into a large downturn as traders rush to exit positions. This mix of technical factors and human reaction can trigger a market crash that reflects both real economic shifts and the effects of panic.
Market crash: Uplifting Investor Outlook
Historical market crashes show that wild speculation and weak oversight can trigger severe downturns and lead to lasting reforms.
• In 1929, frantic trading in hotel-hosted exchanges and clashes between brokers and policymakers drove wild price swings.
• On Black Monday 1987, the Dow Jones fell 22.6% in one day as automated trading and rapid sell-offs fueled panic.
• The 2008 financial crisis exposed flaws in banking and risk management, causing widespread credit troubles and market instability.
These events prove that loose controls and overenthusiastic trading can result in dramatic market corrections. Yet, the lessons learned have helped shape tighter regulations and more resilient market practices over time, giving investors renewed confidence for the future.
Market Crash Indicators: Signals and Early Warnings
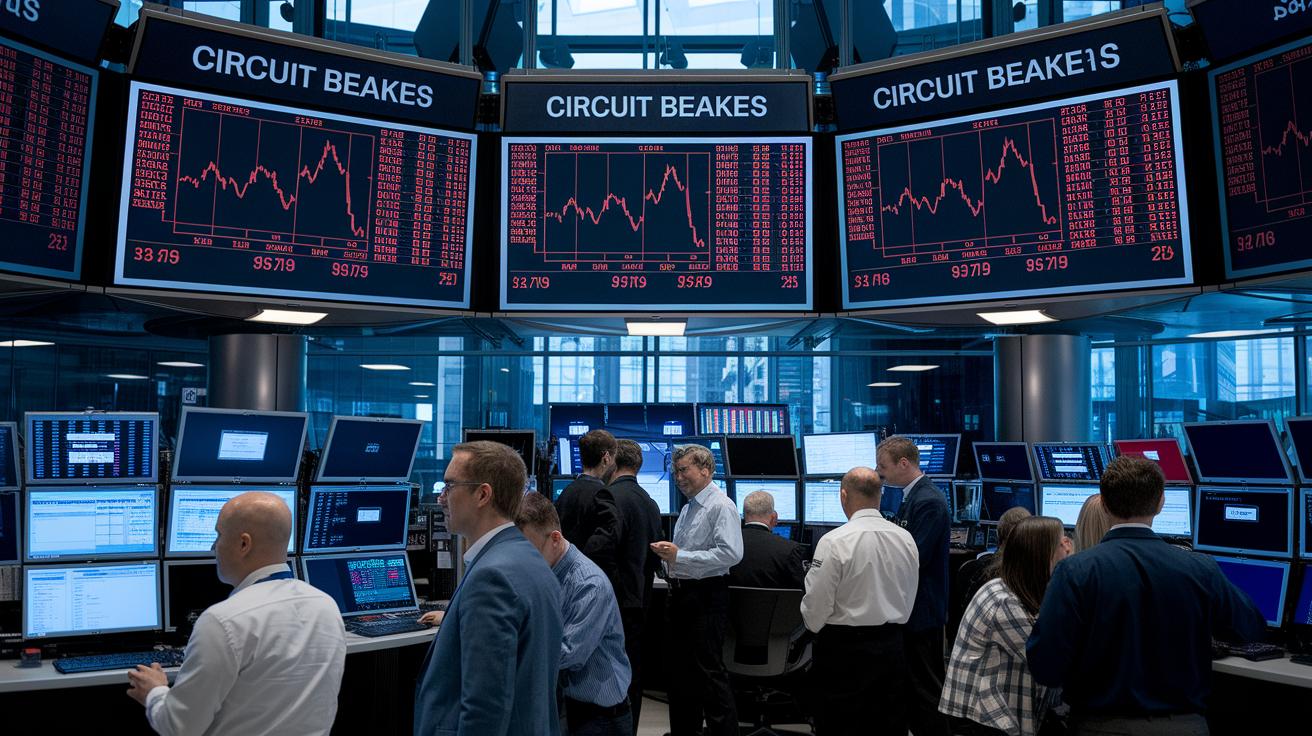
Trading floors and computer systems monitor circuit breakers that pause trading during rapid sell-offs. Prediction markets now show a 16% chance that the S&P 500 could drop 7% in one day by 2025, while language-model estimates put the odds of a 30% decline over a year between 6% and 10%. These preset thresholds help alert investors quickly when volatility rises.
• Circuit breakers halt trading when declines hit set limits.
• Spikes in trading volume often point to market stress.
• Rapid price changes signal shifting investor sentiment.
By watching multiple indicators together, investors can better understand market pressure. No single signal predicts a crash for sure, but a combination of alerts can guide faster, more informed decisions.
Analytical Approaches to Forecasting Market Crashes
Expert surveys ask industry professionals about the chance of a significant market drop. They combine expert opinions with statistical models to estimate early odds of a 30% decline, offering a simple way to gauge market risk.
Prediction markets let traders buy and sell contracts based on expected price moves. These platforms collect many individual forecasts to produce real-time probability estimates, giving swift, market-driven signals that may flag sudden shifts.
Language models like ChatGPT analyze past trends and current valuation levels to generate probability ranges. Current estimates put the risk of a severe downturn between 6% and 10%, adding another quantitative view to market forecasts.
Options-based modeling uses traded options prices to calculate the market’s expectations for future volatility. This method computes the odds of a 30% fall over the next year, providing a clear risk measure that complements other forecasting tools.
Market Crash Risk Management and Protection Strategies

Investors can safeguard their portfolios during market stress with clear, actionable strategies. Using a disciplined approach limits losses and keeps long-term goals within reach during sharp market declines.
• Diversify your holdings between stocks and bonds to lower risk.
• Buy quality stocks when prices drop to attractive levels.
• Regularly rebalance your portfolio to stick to your risk target.
• Get a second opinion from trusted financial experts to avoid emotional choices.
• Consider Roth IRA conversions during downturns for future tax-free growth.
Choosing safe asset havens further boosts your defense. Moving assets into high-quality bonds or stable, dividend-paying stocks can help protect your capital. These assets typically show lower volatility during crises, preserving value while leaving room for gains when the market recovers.
Keep a close eye on market conditions and adjust your asset allocation as needed. This proactive approach not only shields your portfolio during a crash but also sets you up for long-term growth as conditions improve.
Recovery Patterns After a Market Crash
Historical data shows that markets often rebound within 6 to 12 months following a major crash, but a complete recovery from a decline of over 30% may take several years as investor sentiment and fundamentals slowly stabilize.
• Early market gains can appear within months, though full recovery takes time.
• Central banks and fiscal authorities have boosted confidence with rate cuts, liquidity injections, and targeted policies.
• Investors may improve returns by focusing on companies with strong fundamentals and sectors that benefit from economic stabilization.
Coordinated policy actions have historically accelerated market turnarounds. Governments and central banks use tools like rate cuts and liquidity programs to quickly restore investor confidence and drive new capital into the market. If you’re recalibrating your portfolio, target companies with solid balance sheets and industries poised for recovery. Regular portfolio reviews and gradual rebalancing can help manage risk while taking advantage of the market’s steady rebuilding process.
Final Words
In the action, we defined a market crash, examined its triggers, and reviewed historical examples to anchor our discussion. We broke down the causes behind the sharp declines, highlighted early warnings and forecasting tools, and detailed risk management tactics to help protect portfolios.
Each section provided clear signals for traders to spot opportunities amid volatility.
This guide reinforces practical measures to manage risk and anticipate recovery patterns. Stay informed and agile as you monitor and respond to market moves.
FAQ
What are the predictions for a market crash in 2026?
The idea of a 2026 crash mixes forecast models and market sentiment. While some indicators suggest vulnerability, no model definitively predicts a crash in that specific year.
What happened during the 1929 stock market crash?
The 1929 crash resulted from rampant speculation and loose oversight, leading to a severe drop in stock prices and significant market reforms that reshaped financial regulation.
How is a “stock market crash today” defined?
A stock market crash today describes a sharp, sudden drop in indices during a single trading session, reflecting market anxiety, economic surprises, or technical triggers that prompt widespread selling.
How are stock market crash predictions made?
Analysts use technical indicators, historical data, expert surveys, and prediction markets to gauge risk, though these methods involve uncertainty and no prediction guarantees an exact outcome.
What does stock market crash history reveal?
History shows that crashes are rare events marked by speculative bubbles, rapid policy shifts, and panic selling, offering important lessons for risk management and long-term investment strategies.
Why is the stock market crashing?
A market crash often follows rapid monetary policy changes, speculative excesses, or economic events that trigger widespread sell-offs, reflecting a reaction to rising uncertainty among investors.
Can I lose my 401k if the market crashes?
A market crash can reduce the value of a 401k portfolio, but diversified asset allocation and long-term strategies usually help protect against complete loss, especially when reinvestment is maintained during downturns.
What does Warren Buffett say about market crashes?
Warren Buffett emphasizes that market crashes are opportunities to buy quality stocks at lower prices, stressing discipline and a long-term perspective to benefit from recovery cycles.
What do predictions say about a stock market crash in 2025?
Prediction markets have estimated probabilities for sharp declines, indicating mild concern for a crash in 2025; however, these estimates remain uncertain due to complex, evolving market factors.