
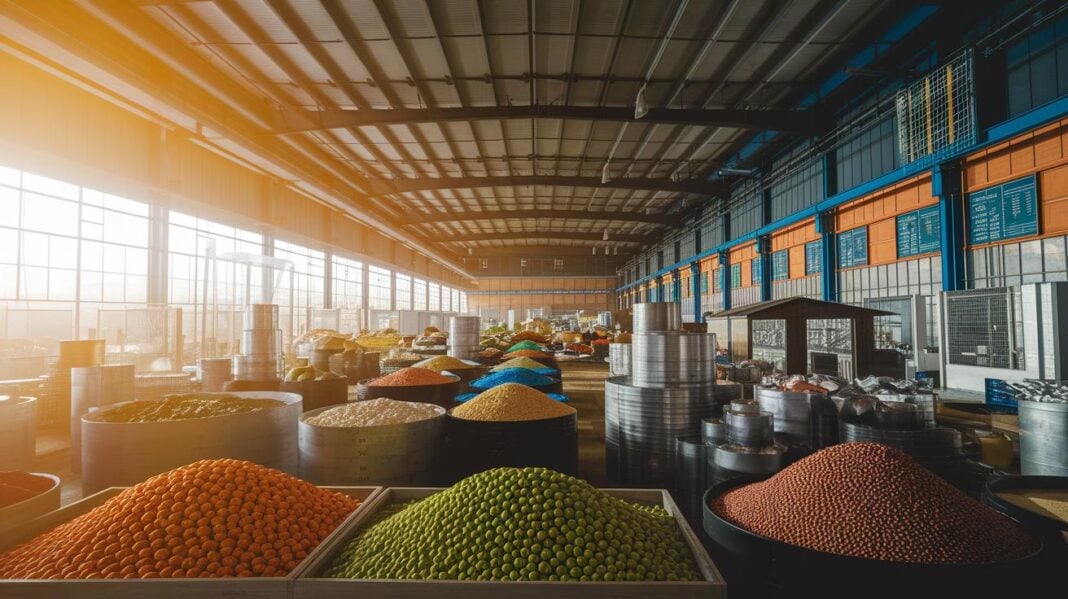

Headline: Seasonal Trends Drive Commodity Prices
Lede: Prices for grains, oil, and coffee follow clear cycles driven by planting, harvest, weather, and holiday demand.
• Planting and harvest cycles shape the supply.
• Weather fluctuations add to price shifts.
• Holiday spending boosts demand.
• Traders can adjust strategies by tracking these trends.
Market Context:
Agricultural activities and seasonal consumer behavior create predictable price patterns. Monitoring these shifts helps traders and investors spot trends and adjust strategies quickly. Understanding these cycles can offer a competitive edge in today’s fast-paced markets.
Core Concepts of Commodity Demand Seasonality
Commodity demand follows predictable yearly cycles that affect prices across markets like agriculture and energy. These cycles arise from natural and economic events that change supply and buyer behavior.
- Planting seasons boost supply, typically lowering prices.
- Harvest periods limit supply, often pushing prices higher.
- Weather, holiday spending, and fiscal schedules also influence price patterns.
- Regular seasonal trends help traders and investors forecast market shifts.
By studying past price data and recurring trends, analysts can anticipate changes in commodity prices. This seasonal insight guides decisions on production, inventory, and trading strategies, empowering market participants to act with confidence.
Key Drivers of Seasonal Commodity Demand
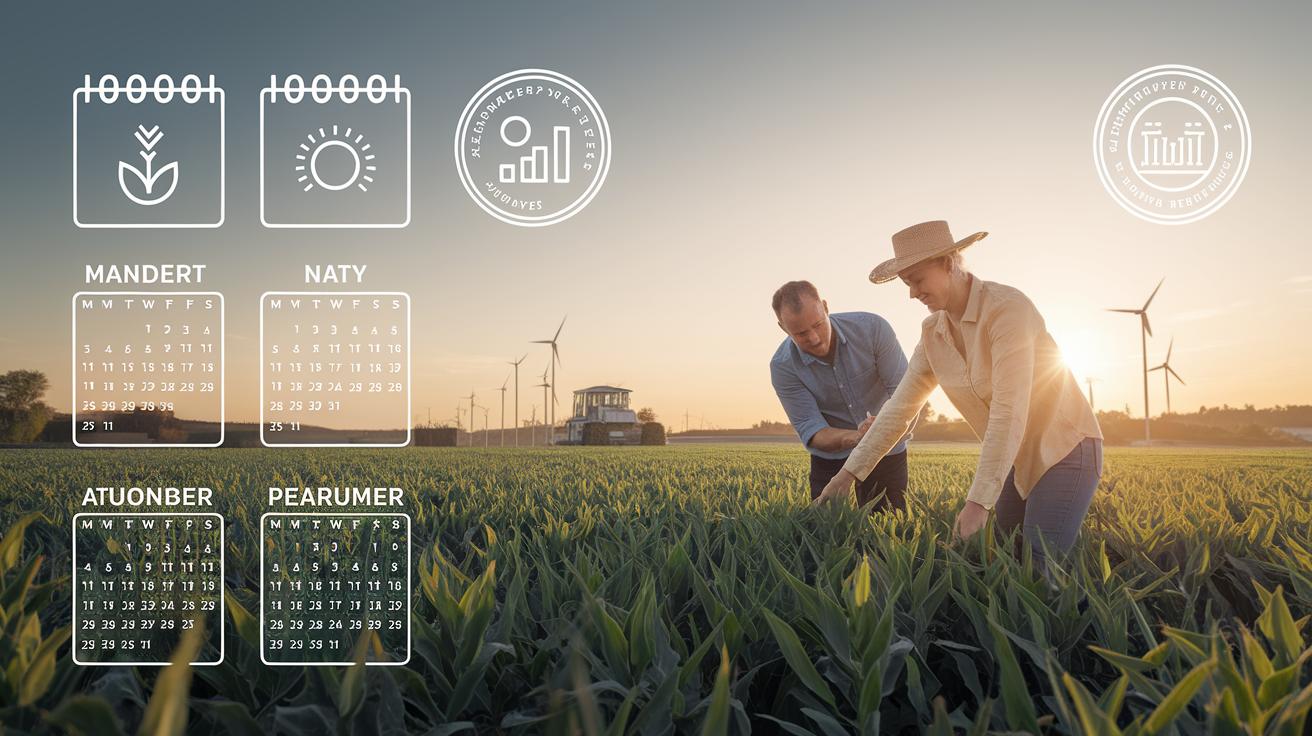
Planting and harvest schedules set the stage for predictable price swings. When crops are planted and gathered, raw material supplies shift, which moves market prices. Extreme weather events like droughts or heavy rains further alter production levels. Government policies, including tariffs and subsidies, also change supply and create annual price swings. Holiday buying spikes add another twist to consumer demand.
Supply chain routines matter, too. Suppliers build up inventories before peak periods, pushing prices higher, then draw down stocks after the busy season.
Market watchers focus on these five factors:
- Planting and harvest cycles
- Extreme weather events
- Shifts in government policy
- Holiday purchase trends
- Inventory management
Traders combine historical trends with current data to turn insights into action. These combined factors drive the recurring market cycles that shape commodity demand.
Seasonal Patterns Across Major Commodities
Commodity prices shift each season as raw material supply and demand change. Coffee prices climb in winter thanks to higher heating needs and holiday demand. Oil sees stronger demand in summer as more gasoline and flights boost consumption. Gold typically rises about 1.8% in January due to increased jewelry and investment buying. Silver also gains roughly 3% in January and February driven by industrial and seasonal demand.
• Coffee prices increase in winter with heating demand and holidays.
• Oil demand peaks in summer from gasoline and aviation needs.
• Gold and silver see early-year boosts from strong seasonal buying.
| Commodity | Seasonal Peak Period | Avg. Price Change | Key Driver |
|---|---|---|---|
| Coffee | Winter | Varies | Heating, holiday demand |
| Oil | Summer | Varies | Gasoline, aviation use |
| Gold | January | +1.8% | Jewelry, investment |
| Silver | January–February | +3% | Jewelry, industrial activity |
Traders use these seasonal trends to time their buying and selling. Understanding each cycle can help them manage inventory and plan entry or exit points effectively.
Analyzing Seasonality with Data and Tools

Historical Price Data Analysis
Traders study several years of price data to spot seasonal trends that short-term views can miss. By reviewing multi-year datasets, they identify regular peaks and valleys that signal shifts in supply and demand. This analysis highlights long-term cycles and helps forecast periods of high or low consumption. For example, historical data can show how commodity prices tend to act during certain months, giving market participants a clearer view of expected demand.
Charting and Seasonal Indicators
Visual tools like seasonal line charts, moving averages, and the relative strength index (RSI) help confirm consistent market trends. These methods break down annual price fluctuations, making it easier to see when markets typically move up or down. When traders notice repeated rises or falls that align with historical seasonal patterns, they can better time their trades and manage risk.
Integrating Seasonality with Other Analyses
Merging seasonal insights with current fundamental and market sentiment data creates a stronger forecast model. Combining historical trends with real-time economic indicators allows traders to account for both predictable cycles and unexpected market shifts. This integrated approach improves decision-making by ensuring that seasonal patterns are analyzed alongside broader market factors.
Supply Chain and Economic Impacts of Commodity Demand Seasonality
Commodity supply chains follow clear seasonal patterns. Firms bulk up inventories before peak seasons and draw them down afterward. They must time purchases carefully to control storage costs and smooth out logistics. This approach helps producers and traders balance raw material flows throughout the year.
• Firms stockpile commodities ahead of harvests or holiday seasons to avoid shortages, even as storage expenses rise.
• Local economies can see short-term boosts when high seasonal sales drive regional growth.
• Businesses use hedging strategies, like futures contracts, to protect margins during slower periods.
• Close monitoring of seasonal indicators guides production scheduling, contract negotiations, and more efficient transport planning.
Forecasting Demand Peaks and Trading Strategies

Traders use seasonal trading patterns to trade predictable shifts in commodity demand. Spread trading captures price differences between low and high seasons, like the summer crude oil spread, letting market participants profit from recurring supply and demand gaps.
Options add power to the strategy. Traders use calls and puts to position ahead of known seasonal peaks or dips. This approach keeps risk in check while targeting price moves during strong market momentum.
Algorithmic models further streamline the process. By coding historical cycles and current data into predictive intervals, traders can spot demand spikes early and adjust positions as market conditions change.
• Spread trading secures gains from seasonal price gaps.
• Options strategies offer directional moves with managed risk.
• Algorithmic models use past and present data for timely adjustments.
Together, these techniques help risk managers optimize profitability and balance exposures by turning seasonal patterns into real trading opportunities.
Actionable Insights for Managing Seasonal Commodity Demand
Decision-makers can use seasonal trends to adjust operations and steer through predictable shifts in commodity demand. These steps help control price swings, improve inventory handling, and fine-tune production and cost management.
- Align procurement with production by creating a seasonal calendar to capture holiday trends.
- Refine inventory levels and contract timing through demand cadence forecasting based on historical patterns.
- Adjust pricing or use hedging strategies during low-demand periods to maintain smooth cash flow.
- Merge seasonal insights with live market data to quickly adjust supply plans.
- One study showed that integrating seasonal analysis cut costs by about 5%, proving the strategy works.
These recommendations provide a clear roadmap for managing seasonal cycles, cutting inventory volatility, and boosting profit margins. For more insights, visit: https://newsfinnow.com?p=877
Final Words
in the action, this piece breaks down the key drivers behind commodity seasonality.
It covers annual fluctuations, resource cycles, and raw material oscillations while showing how data tools solidify market shifts breakdown.
Practical insights help streamline inventory management and trading strategies so you can capitalize on demand peaks.
With seasonality in commodity demand explained, the analysis arms you with clear, actionable points to watch for in the market.
Positive trends and calculated steps pave the way for confident decision-making.
FAQ
What is seasonality in commodities?
The term seasonality in commodities refers to predictable price changes tied to annual cycles like planting, harvest, weather, and holidays that help traders time market moves.
What are some seasonal commodities examples?
Seasonal commodities examples include coffee, oil, gold, and silver, which show price shifts during winter holidays, summer travel, or periods of increased demand due to seasonal factors.
How does seasonal commodity trading work?
Seasonal commodity trading works by capitalizing on recurring price trends driven by predictable supply and demand shifts, enabling traders to plan entries and exits around well-known cycles.
How do seasonal charts help analyze commodity trends?
Seasonal charts help analyze commodity trends by mapping historical price patterns, allowing traders to identify recurring peaks and troughs linked to cyclic factors like weather and harvesting.
How can intra-market correlation improve commodity momentum?
Intra-market correlation improves commodity momentum analysis by highlighting linked price movements among related commodities, offering insights into potential shifts in trading momentum.
What are seasonal trading patterns and how do they work?
Seasonal trading patterns represent recurring price behaviors seen over specific times of the year, enabling traders to align strategies with predictable supply, demand, and market sentiment variations.
What is the Euro seasonal tendency chart?
The Euro seasonal tendency chart illustrates recurring exchange rate trends based on historical seasonal influences, providing traders insights into potential periods of strength or weakness in the Euro.
What does seasonality gold mean?
Seasonality in gold refers to typical price trends, like gains in January driven by jewelry and investment demand, offering traders a signal for potential seasonal adjustments in the market.
What are the 7 C’s of commodities?
The 7 C’s of commodities are a framework that reviews critical factors such as quality, cost, consistency, currency, contracts, cycles, and market conditions, guiding assessment of commodity performance.
What is the meaning of seasonality of demand?
Seasonality of demand means that consumer demand fluctuates predictably over the year, influenced by events, weather, and holidays, which impacts pricing and procurement strategies.
How can seasonality be explained?
Seasonality can be explained as the recurring, predictable patterns in market behavior resulting from natural cycles like weather changes, agricultural schedules, and holiday trends that drive consumer demand.