


Bond Yields Signal Shifting Market Sentiment
Short-term rates are falling while long-term yields climb, widening the gap and prompting higher risk premiums amid fiscal concerns.
• Short-term yields drop as long-term rates rise.
• Municipal bond yields jumped up to 76 basis points.
• Investors now demand higher premiums amid fiscal pressure.
• The trend hints at evolving economic views and potential market optimism.
Yield Curve Steepening Defined and Illustrated
Yield curve steepening occurs when the gap between short-term and long-term bond yields widens. This means yields on longer bonds rise compared to those on shorter ones. For instance, longer-term municipal bonds saw yields jump by up to 76 basis points, while bonds with maturities under 10 years dropped. Traders watch this pattern closely as it signals shifting economic expectations.
• The spread between bond maturities is key.
• The AAA municipal 5-year versus 30-year spread expanded from 103 basis points at year-end to 217 basis points in July.
• This indicates a higher yield demand for locking funds into long-term bonds amid fiscal pressure concerns.
• Similar behavior is expected in the U.S. Treasury market, with short-term rates potentially falling while longer-term premiums rise.
In charts, the yield curve plots rates on the vertical axis against time to maturity on the horizontal. A steepening curve is marked by a pronounced upward tilt. Overlaid charts comparing short- and long-term yields quickly reveal where rates are rising and where investors might find relative value.
Key Drivers of Yield Curve Steepening Trends

Short-term U.S. Treasury yields are falling as the Federal Reserve nears a rate cut, lowering borrowing costs immediately.
• Short-term bonds benefit from lower rates on near-term debt.
• Fiscal pressures boost long-term yields, forcing investors to demand higher premiums.
• In the municipal market, long-duration funds saw $2bn in outflows, while short/intermediate funds attracted $6bn.
The Fed’s expected rate cut drives down yields on short-term bonds, reducing borrowing costs. At the same time, rising government spending and deficits push long-term yields higher as investors seek extra return for added risk. In municipal bonds, weak demand for long-duration issues led to significant outflows compared to inflows on shorter maturities.
Traders view this steepening yield curve as a sign of potential economic growth and rising inflation expectations.
Historical Examples of Yield Curve Steepening Episodes
Mid-2025 saw the AAA municipal 5-year to 30-year spread jump to 217 basis points – the widest gap in 10 years.
- Yields climbed sharply amid fiscal pressures and changing supply-demand.
- Investors viewed the spike as a sign that higher long-term returns could support economic growth.
Early in 2021, U.S. Treasury yields steepened noticeably. Over six months, the 2-10 year spread grew from 50 to 150 basis points.
- This move came as markets prepared for policy shifts.
- Shifts in capital toward shorter-term borrowing boosted confidence in economic fundamentals.
Between 2004 and 2006, a similar steepening occurred before central bank rate hikes.
- Rising long-term yields signaled an upcoming tightening cycle.
- These movements offered early cues for investors to adjust portfolio risks as economic conditions changed.
Market Impact on Fixed Income Instruments During Steepening

Longer-term municipal bonds have underperformed compared to short- and intermediate-term funds as yields rise. Taxable-equivalent yields near their highest levels in a decade, making the spread between munis and Treasury securities more appealing. When yields climb, longer-duration bonds drop in price, which pressures their valuations. In contrast, shorter-duration bonds often generate a solid yield carry that helps counterbalance their price declines.
Treasury steepening drives a two-part effect. Longer-term bonds fall in value but offer higher yields for those willing to commit for the long haul. Meanwhile, short-term bonds benefit from lower borrowing costs, giving them an edge during market volatility. This gap between short- and long-term instruments has traders looking at yield-carry trades as a way to achieve better risk-adjusted returns.
• Yields rising boost overall rates and widen credit spreads, rewarding investors for taking on more risk.
• Weak valuations in long-term munis paired with steady short-term flows create clear trading opportunities.
• Investors may want to adjust their portfolio durations as steepening shifts the pricing across different maturities.
Market watchers are tracking these changes closely, keeping an eye on bond prices, yield carry, and credit spreads to fine-tune their strategies in the evolving yield environment.
Investment Strategies in a Yield Curve Steepening Environment
Traders are watching yield curve steepening fuel economic confidence and are shifting toward structured trades. They use a barbell approach by investing in both short-term and long-term bonds, aiming to limit risk while positioning for potential Federal Reserve rate cuts. Some investors also lean toward a bullet strategy, targeting bonds with similar maturities to seize yield opportunities as term premiums expand.
• Barbell trades combine short-term bonds with longer-term issues, balancing lower borrowing costs against higher long-term yields.
• Bullet strategies focus on mid-duration bonds, which may benefit most from anticipated policy adjustments.
• Investor flows show a clear trend: short- and intermediate-term municipal funds attracted $6bn in inflows in H1 2025 while long-duration funds saw $2bn in outflows, signaling a preference for shorter maturities.
A twist strategy comes into play when rebalancing portfolios. This method shifts funds from long-duration bonds, now riskier due to increased term premiums, into shorter bonds that offer a solid yield. As yield differentials grow, tactical adjustments in bond trading can capture incremental gains based on current fund-flow trends.
Investors should diversify across maturities to manage risk and adjust to market sentiment and policy shifts, making the most of emerging relative-value opportunities in a steepening yield curve.
Visual Tools and Charting Techniques to Track Steepening

Moving-spread charts show the gap between short-term and long-term yields in real time, letting traders see yield changes as economic conditions shift. Slope-over-time plots reveal the yield curve’s tilt over history, making steepening trends easier to spot. Fund-flow dashboards track weekly inflows, for instance, recent figures show $937 million in municipal inflows with $573 million allocated to intermediate funds, while backloaded 2025 new-issue municipal supplies add pressure on longer maturities.
These visual tools simplify market data and support fast decision making. Investors can use them together to gauge how shifts in supply and demand affect yields.
| Chart Type | Data Source | Key Insight |
|---|---|---|
| Moving-Spread Chart | Real-time yield data | Dynamic yield differentials |
| Slope-Over-Time Plot | Historical yield data | Yield curve tilt trend |
| Fund-Flow Dashboard | Weekly fund flow reports | Supply-demand balance and inflow trends |
Sector and Regional Implications of Yield Curve Steepening
U.S. municipal yields are moving in a different direction than Treasury yields. Long-term munis have risen by up to 76 basis points, while Treasury rates for under-10-year bonds are falling uniformly. This creates a clear value shift as investors choose munis for their higher yields against lower short-term Treasury rates.
• Municipal bonds up by 76 basis points contrast with falling Treasury rates.
• Global sovereign debt shows less dramatic drops at the short end compared to U.S. Treasuries.
• Corporate spreads are widening, hinting that long-term corporate borrowing costs might increase.
Internationally, sovereign debt markets are acting differently. In Europe and Asia, fiscal pressures have led to slow adjustments across maturities, with long-term rates not moving as much. This makes it easier to compare the steep U.S. muni market with steadier curves abroad.
The diverging trends are forcing market participants to rethink risk premiums. As differences between municipal and Treasury rates grow, traders are closely watching corporate spreads to identify relative value opportunities. Investors should factor in these regional and sector shifts when assessing yield prospects and risk premiums.
Forecasting and Outlook for Yield Curve Steepening Dynamics
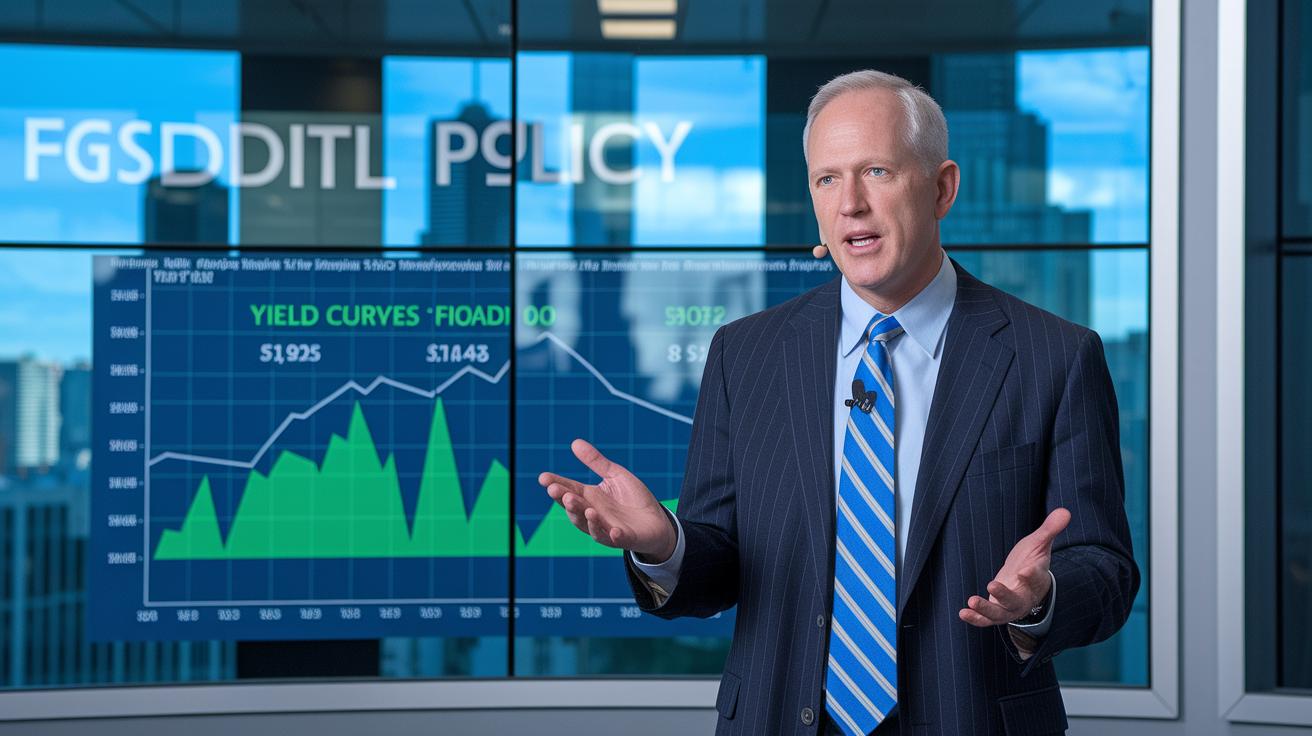
Treasury yields are set to steepen as short-term rates fall ahead of expected Fed cuts while fiscal pressures push term premiums higher. Bill Campbell from DoubleLine says that any drop in near-term rates will likely widen the gap between short- and long-term yields. He believes that political gridlock and occasional government shutdowns will not derail this long-term trend, even if market jitters occur in the short term.
• Fast scenario: If rate cuts come in stronger than expected and fiscal stress eases slightly, short-term rates could drop quickly while long-term yields rise more slowly. This would narrow the spread and offer advantages for investors looking to reduce duration risk.
• Steady scenario: With modest Fed rate cuts and persistent fiscal pressures, long-term yields may gain about 20 to 30 basis points over short-term rates. This consistent steepening supports current yield-seeking strategies, in line with Campbell’s outlook.
• Cautious scenario: If fiscal pressures worsen or the Fed adopts a tighter stance, term premiums could rise faster and further widen the yield curve. Still, political gridlock is expected to keep the curve’s overall shape largely undisturbed.
Investors should watch for key policy announcements and market cues. The upcoming “Just Markets” webcast on Jan. 13, 2026, is set to shed more light on rate adjustments and future yield curve slopes.
Final Words
In the action, yield curve steepening drives clear shifts in municipal and Treasury markets. We broke down its definition, offered real examples, and mapped out key trends with charts and data. Investors see how policy moves and market flows impact bond prices and credit spreads. This guide lays out strategies and tools that make these changes easier to track and trade. The insights here help shape smart, timely decisions in an ever-moving market.
FAQ
What does a yield curve steepening graph show?
The yield curve steepening graph shows an increasing gap between short- and long-term yields measured in basis points, highlighting market expectations for rate cuts or fiscal pressures affecting bond prices.
What is a yield curve steepening forecast?
The yield curve steepening forecast predicts that short-term rates could fall while long-term yields rise due to fiscal pressures and market expectations, leading to wider spreads between maturities.
What does bond yield curve steepening mean?
Bond yield curve steepening means that longer-term bond yields are rising relative to short-term rates, driven by economic outlooks and policy expectations that expand the yield spread.
What is the meaning of yield curve steepening?
Yield curve steepening means the yield gap between short- and long-term bonds is widening, often signaling anticipated short-term rate cuts or increased long-term fiscal pressures.
How do yield curve flattening and steepening differ?
Yield curve flattening and steepening differ in that flattening shows a narrowing rate gap while steepening reflects a widening spread, indicating divergent market views on short- versus long-term rate movements.
What does yield curve steepening today indicate?
Yield curve steepening today indicates that current market conditions are showing rising long-term yields compared to short-term rates, influenced by recent policy moves and fiscal pressures.
What does a steepening curve imply?
A steepening curve implies that the spread between short-term and long-term yields is growing, which often signals market anticipation of policy shifts or economic changes in the near future.
What does a flattening yield curve imply?
A flattening yield curve implies that short-term and long-term yields are converging, which can signal reduced growth expectations or shifts in monetary policy dynamics.
Is a steepening yield curve good for banks?
A steepening yield curve is good for banks because it can widen net interest margins, allowing them to borrow at lower short-term rates and lend at higher long-term yields, improving overall profitability.
Has the US yield curve steepened recently?
The US yield curve has steepened recently, with wider spreads between short-term and long-term Treasury yields driven by monetary policy shifts and fiscal pressures in the market.
What does a steep curve indicate?
A steep curve indicates that markets expect lower short-term rates and higher long-term yields, suggesting different outlooks for economic and fiscal conditions influencing bond returns.
How can traders profit from a steepening yield curve?
Traders can profit from a steepening yield curve by using strategies like barbell, bullet, or twist trades that exploit the widening spread between long- and short-term bonds, capturing yield differentials.